You know how many hours your team worked last week. But do you know how many of those hours were profitable? For most agencies and service teams, the answer is a confident "roughly." That rough estimate is where margin disappears. Momentum Studio, a 12-person creative agency, discovered a 15% increase in project profitability after switching from manual tracking to automatic capture — not by working more, but by finally seeing where hours were actually going. Project-level profitability stays invisible until you connect tracked hours to actual costs and revenue per client — and most time tracking tools weren't built to do that.
Quick Answer
Choose Rize if you want automatic project-level capture with zero timers. Choose BigTime if you need built-in P&L with phase-level margins. Choose Harvest if your team already has strong manual timer habits. Choose TMetric or Beebole if budget is the top constraint.
The gap between "we tracked our time" and "we know which projects make money" is where agencies lose margin without realizing it. Closing that gap requires a specific kind of tool: one that tracks time at the project level, assigns costs, and produces margin data you can act on. Here's what to look for and how five tools compare.
What Makes Time Tracking Project-Based
Generic time tracking tells you how long someone worked. Project-based time tracking tells you how long someone worked on what — and what that work cost relative to what you charged. The distinction matters because agency profitability isn't one number. It's a number per client, per project, per retainer.
A project-based tool needs to do three things well. First, it maps hours to specific projects or clients automatically, without requiring your team to remember to switch timers between tasks. Second, it applies cost rates — each team member's fully-loaded hourly cost — to those hours. Third, it compares that cost data against revenue to produce margin reports at the project level.
Without all three, you're stuck exporting CSVs into a spreadsheet to do the math yourself. That works for a five-person team with three clients. It breaks down fast when you're running 15 projects across eight clients with a team of 20.
How Five Tools Compare
| Tool | Project Tracking | Profitability Reporting | Automation Level | Pricing | Best For |
|---|---|---|---|---|---|
| Rize | AI-categorized by app, site, and project | Team dashboards with cost/revenue views | Fully automatic — no timers | $18/user/mo | Agencies wanting accurate, zero-effort capture |
| Harvest | Manual timer with project/task hierarchy | Budget vs. actual reports per project | Manual — start/stop timers | $10.80/user/mo | Teams already committed to manual entry |
| BigTime | Project-centric with phase/task breakdown | Built-in P&L per project and client | Manual — timesheet-based | $20/user/mo | Professional services firms (accounting, consulting) |
| TMetric | Project tagging with client grouping | Cost rates and billable summaries | Manual — browser extension timers | $7/user/mo | Budget-conscious teams needing basic margins |
| Beebole | Project/subproject structure with custom fields | Margin reports with cost/bill rate comparison | Manual — weekly timesheet grid | $6.99/user/mo | Mid-size teams wanting structured reporting |
Tool-by-Tool Breakdown
Rize — Automatic Capture with AI Categorization
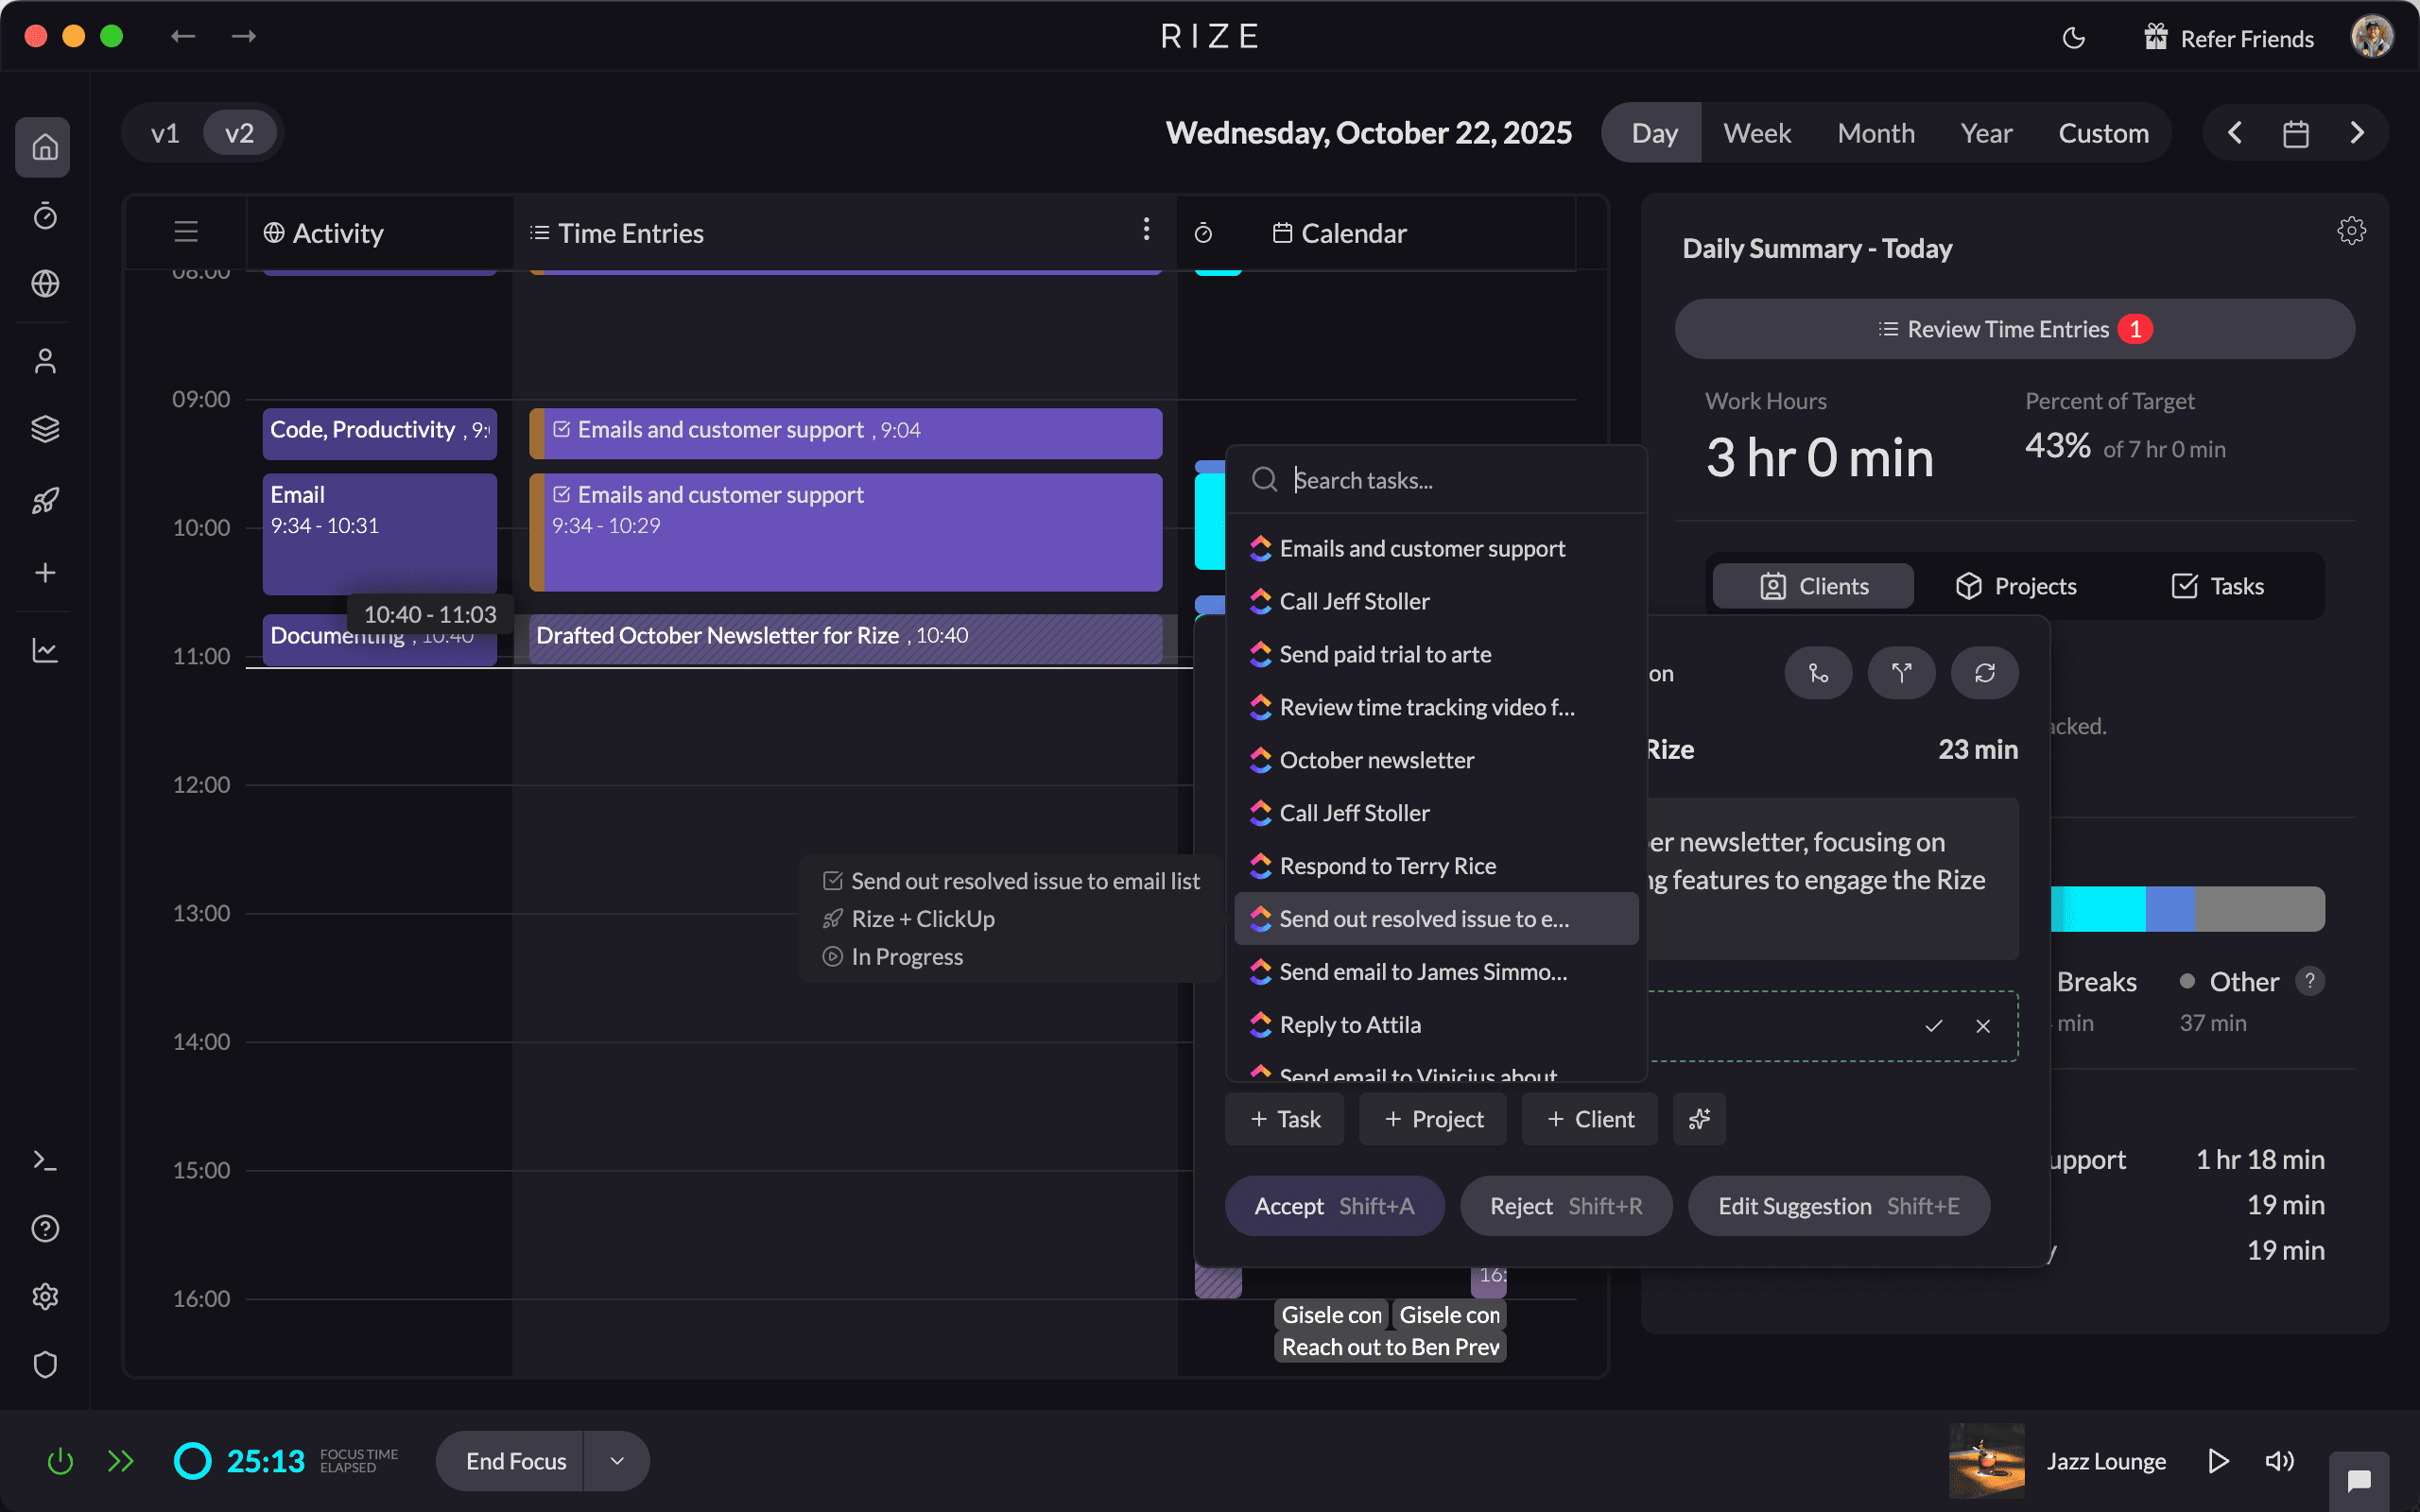
Rize works differently from the other tools on this list. Instead of requiring your team to start timers or fill out timesheets, it runs quietly in the background and captures time automatically based on which applications and websites are in use. When a designer spends 45 minutes in Figma on a client project, Rize logs it. When they switch to Slack for 10 minutes to discuss a different project, that gets categorized separately. No manual input required.
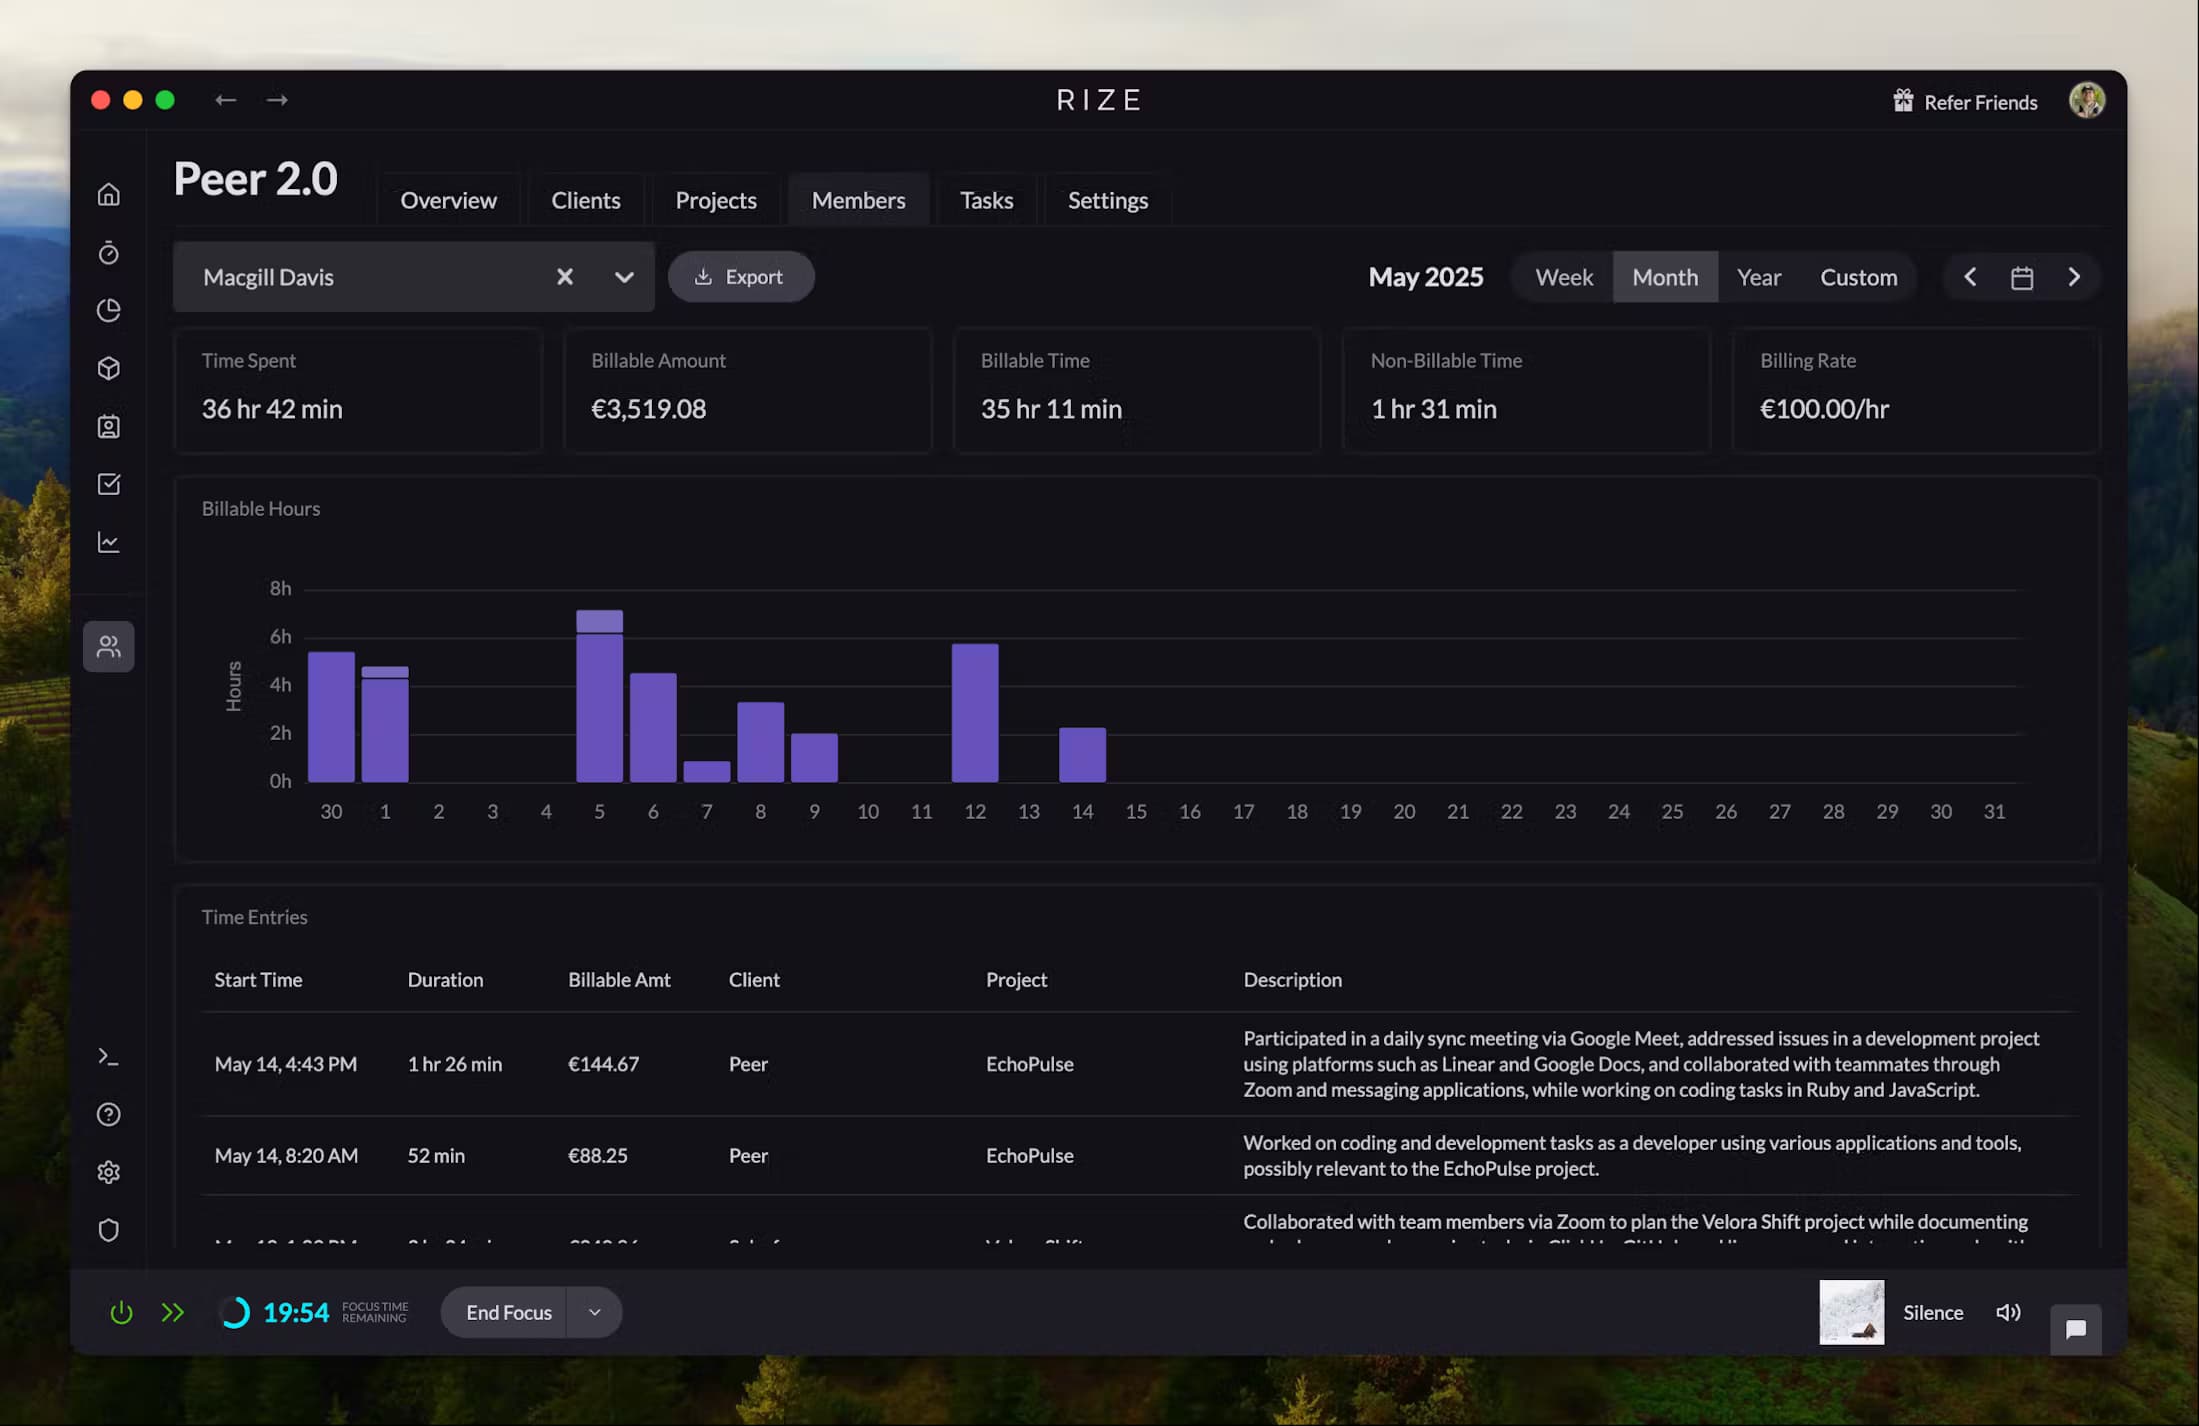
The AI categorization assigns time to projects and clients based on patterns — window titles, URLs, application context. This means you get a granular breakdown of where hours went without anyone on your team needing to remember to click a button. For profitability, Rize's team dashboards show cost and revenue data per project, making it straightforward to identify which clients are profitable and which are quietly burning margin.
Ben Jackson, CEO of Momentum Studio, a 12-person creative agency that previously used Harvest, saw a 15% increase in project profitability after switching: "Rize allows my team to get deep into work and go where their creativity leads them without really having to think about time tracking." The tradeoff: Rize's strength is accuracy and low friction. If you need built-in invoicing or project management features like Gantt charts, you'll pair it with another tool. But for the core question — "where did my team's time actually go, and was it profitable?" — automatic capture produces data that manual tools can't match.
Key strengths
- Fully automatic time capture — no timers, no manual entry, no forgotten hours
- AI categorization assigns time to the correct project based on app context and window titles
- Team profitability dashboards show cost vs. revenue per project in real time
Possible limitations
- No built-in invoicing — requires pairing with a billing tool like QuickBooks or Xero
- Desktop-only — no mobile app for tracking time away from a computer
- Less suited for teams that need Gantt charts or project management features alongside tracking
Harvest — Mature Manual Tracking with Budget Alerts
Harvest has been around since 2006, and it shows — in a good way. The project/task hierarchy is clean, the reporting is solid, and the integration list covers most PM tools. Budget tracking alerts you when a project passes 80% of its hour budget, which is useful for catching overruns before they become losses.
Where Harvest falls short is accuracy. It's entirely manual, which means your data is only as good as your team's discipline. If someone forgets to start a timer before jumping into ClickUp for 90 minutes, those hours vanish from the record. Harvest also lacks built-in profitability dashboards — you get budget vs. actual hours, but connecting that to margin requires exporting data and applying cost rates in a spreadsheet.
Key strengths
- Mature product with a wide integration ecosystem covering most PM and accounting tools
- Budget alerts notify you when a project hits 80% of its hour budget
- Built-in invoicing with QuickBooks and Xero sync
Possible limitations
- Entirely manual — data accuracy depends on team discipline with timers
- No built-in profitability dashboards; margin analysis requires spreadsheet exports
- Short tasks and context switches are frequently missed in manual logging
BigTime — Built for Professional Services Billing
BigTime is designed for accounting firms, consultancies, and other professional services businesses where project billing is the core revenue model. Its per-project P&L reports are strong — you can see margin by project, by client, by phase, with cost rates applied automatically. The invoicing workflow is tightly integrated, so hours flow directly into bills.
The downside is complexity. BigTime is more than a time tracker — it's a PSA (professional services automation) platform. Setup takes longer, the learning curve is steeper, and the interface prioritizes power over simplicity. For creative agencies that want quick visibility into margins without managing a full PSA system, it can feel like overkill.
Key strengths
- Per-project P&L reports with phase-level and client-level margin breakdowns
- Tightly integrated invoicing — hours flow directly into bills
- Purpose-built for professional services firms with complex billing structures
Possible limitations
- Steep learning curve and longer setup time compared to simpler trackers
- Manual timesheet entry — no automatic time capture
- Can feel like overkill for creative agencies that need quick margin visibility without full PSA
TMetric — Budget-Friendly with Solid Basics
TMetric's pricing makes it accessible for smaller teams. At $7 per user per month, you get project tracking, cost rates, and billable hour summaries. The browser extension integrates with tools like ClickUp, Jira, and Asana, letting you start timers from within your PM tool.
The profitability reporting is limited compared to BigTime or Rize. You can compare billable vs. non-billable hours, but generating a true margin report by project requires manual calculation. TMetric is a good starting point for teams that need project-level visibility without a large per-seat cost.
Key strengths
- Lowest per-seat cost at $7/user/month — accessible for smaller teams
- Browser extension integrates with ClickUp, Jira, and Asana for in-context timer starts
- Billable vs. non-billable hour summaries with cost rate support
Possible limitations
- No true margin-per-project reporting — requires manual calculation for profitability
- Manual timer-based tracking with no automatic capture option
- Reporting depth is limited compared to BigTime or Rize
Beebole — Structured Reporting for Mid-Size Teams
Beebole's strength is its reporting flexibility. Custom fields, subproject hierarchies, and configurable dashboards let you slice time data in ways that match your billing structure. The margin reports compare cost rates against bill rates at the project level, which gives you a clearer profitability view than most manual trackers.
Like Harvest and TMetric, Beebole relies on manual entry — in this case, a weekly timesheet grid. The data quality depends entirely on whether your team fills it in accurately and on time. For teams that already have strong timesheet discipline, Beebole's reporting capabilities make it a solid option. For teams where compliance is a struggle, the data gaps will undermine the margin reports.
Key strengths
- Flexible reporting with custom fields, subproject hierarchies, and configurable dashboards
- Margin reports compare cost rates against bill rates at the project level
- Weekly timesheet grid suits teams with established timesheet habits
Possible limitations
- Manual weekly timesheet entry — data quality depends on team compliance
- No automatic time capture or AI categorization
- Less suited for teams that struggle with consistent timesheet submission
Know which projects actually make money
Rize auto-tracks time by project and shows profitability in real time. Free for 7 days.
Start Free TrialHow Project-Level Profitability Reporting Works
The data pipeline from tracked hours to a useful margin dashboard has four stages. Getting each one right determines whether your profitability numbers reflect reality or just approximate it.
Stage 1: Time capture. Hours are recorded and assigned to a project. In manual tools, this means someone selects a project from a dropdown and starts a timer. In Rize, this happens automatically — Figma time gets tagged to "Client A – Brand Refresh" based on the file name and AI pattern matching.
Stage 2: Cost assignment. Each tracked hour gets multiplied by the team member's fully-loaded cost rate. A senior developer at $65/hour working 12 hours on a project adds $780 to the delivery cost. Most project-based tools let you set cost rates per team member — our team profitability tracking calculator walks through how to set these rates and model margins for your specific team size.
Stage 3: Revenue mapping. Project revenue — whether from a fixed bid, retainer, or hourly billing — is entered or synced from your invoicing tool. The system now has both sides of the equation: what it cost you and what you charged.
Stage 4: Margin calculation. Revenue minus total cost, divided by revenue, gives you gross margin per project. A $15,000 project with $8,500 in labor and $500 in direct costs has a 40% margin. If your target is 50%, you know this project underperformed — and you can investigate where the extra hours went. Momentum Studio used exactly this kind of per-project margin view to identify which clients were quietly eating into their margins — leading to the 15% profitability improvement Ben Jackson's team saw after switching to automatic capture.
Why Automatic Capture Changes the Math
Here's the problem with building profitability reports on manual time data: the hours are wrong. People forget to start timers, round durations, and skip short tasks entirely. The gap between what actually happened and what gets logged compounds across a team and a week. When you're running margin calculations on undercounted hours, every project looks more profitable than it actually is.
Consider a real example. A designer works on a Figma mockup for a client, gets pulled into a Zoom call about the same project, then spends 20 minutes in Slack answering questions about it. With a manual timer, they probably logged the Figma time. The Zoom call might get logged if they remembered. The Slack time almost clearly didn't. That's 20-30 minutes of billable work that disappeared from the record — and from the profitability calculation.
Rize captures all three activities automatically. The Figma session, the Zoom meeting, and the Slack conversation all get logged and categorized to the correct project. Over a week, this difference compounds. Over a quarter, it can mean the difference between a project showing 52% margin and the real number of 38%.
This is why Momentum Studio recovered 20% more billable time after switching to automatic capture — those hours were always being worked, they just weren't being recorded. As Ben Jackson puts it: "I'm a trusting leader, but I don't even trust myself to remember what I worked on two days ago. So how can I expect my designers to?" And Impulse Lab achieved 98% billing accuracy with 5x faster client reporting by eliminating the gap between work done and work logged. Their founder Leonard Roussard said: "I installed it and forgot about it for two weeks. When I came back, everything was tracked. I could trust the data completely." Both results came from removing the manual step, not from working harder.
How much billable time is your team missing?
Enter your team size and rates. See the revenue gap in under 2 minutes.
Try the Profit CalculatorHow to Choose Project-Based Time Tracking Software
Before comparing tools, run through these seven criteria to narrow the field based on how your team actually works.
- Data capture method. Does your team reliably start and stop timers, or do hours go unlogged? If compliance is low, automatic capture eliminates the gap between work done and work recorded.
- Profitability reporting depth. Do you need a simple billable vs. non-billable split, or per-project P&L with phase-level margins? Match the tool's reporting to the financial questions you need answered.
- Cost rate granularity. Can you set fully-loaded cost rates per team member, per role, or per project? Without accurate cost rates, margin calculations are unreliable regardless of how good the time data is.
- Integration with your billing stack. If you invoice through QuickBooks, Xero, or FreshBooks, check whether the tool syncs hours and rates directly or requires CSV exports.
- Team size and budget. Per-seat pricing adds up fast. A 20-person team at $20/user/month is $4,800/year — weigh that against the margin visibility you gain.
- Setup and onboarding time. PSA platforms like BigTime offer deep functionality but take weeks to configure. Lighter tools like Rize or TMetric can be running in under an hour.
- Multi-project switching. If your team juggles 5+ projects daily, evaluate how the tool handles context switches. Manual timers miss transitions; automatic capture logs them by default.
Picking the Right Tool for Your Team
The right choice depends on where your pain is. If your team already tracks time diligently and you need better reporting, Beebole or BigTime will give you structured margin data. If you're starting from scratch and want the lowest-cost entry point, TMetric covers the basics. If you need accurate hours without changing your team's workflow, Rize's automatic tracking solves the data collection problem at the source.
From what I have seen working with agency teams over the past two years, the bottleneck isn't reporting — it's the data going into the reports. A profitability dashboard built on inaccurate hours produces confident-looking numbers that are wrong. That's worse than no dashboard at all, because it hides the problem. Start with accurate capture, then build the margin analysis on top. The team profitability calculator guide walks through the math step by step.
Frequently Asked Questions
What is the best project-based time tracking software for profitability reporting?
It depends on your workflow. For automatic time capture with AI-powered project categorization, Rize produces the most accurate data with the least manual effort. BigTime offers the strongest built-in P&L reports for professional services firms. Beebole gives mid-size teams flexible margin reporting at a lower price point. The best choice hinges on whether your priority is data accuracy (Rize), billing integration (BigTime), or budget (TMetric, Beebole).
What is the best time tracking vendor for project-based tracking and profitability by client?
For client-level profitability, you need a tool that maps hours to specific clients and applies cost rates per team member. Rize does this automatically using AI categorization — hours spent in Figma, ClickUp, Slack, and Zoom get assigned to the correct client without manual tagging. BigTime and Beebole also support client-level reporting but require manual time entry to feed the data.
Which time tracking provider has the best profitability dashboards?
BigTime has the most detailed built-in profitability dashboards, with per-project P&L, phase-level margins, and utilization views designed for professional services. Rize's team dashboards give a cleaner, faster view of cost vs. revenue per project and are built on automatically captured data — which means the dashboard numbers reflect actual work, not self-reported estimates.
How does automatic time tracking improve profitability accuracy?
Manual time tracking relies on memory, which means forgotten timers, rounded durations, and skipped short tasks. Those gaps compound across a team. Automatic tracking captures every application switch, meeting, and work session without relying on human memory. This means profitability reports built on automatic data reflect actual delivery costs, not approximations — which prevents the common pattern of projects looking profitable on paper while losing money in practice.
What features should a team profitability calculator include?
A useful profitability calculator needs four inputs: project revenue, hours per team member, fully-loaded cost rates (salary plus benefits, taxes, and overhead), and direct project expenses. The output should show gross profit and gross margin per project. The best tools also show utilization rates and flag projects that fall below your target margin. Rize's free profit calculator estimates hidden revenue loss based on your team size, rates, and current tracking method.
Start tracking time automatically
Join thousands of professionals who stopped guessing where their time goes. Free for 7 days.
“Rize has been a no-brainer for me.” — Ali Abdaal Read more →