
You invoice a client $18,000 for a project. The work gets done. Payment clears. On paper, it looks like a win. But when you add up what your team actually spent on it — salaries, benefits, software, the three rounds of revisions nobody tracked — you are looking at $20,000 in costs. You just lost $2,000 and did not know it until the quarter closed.
Quick Answer
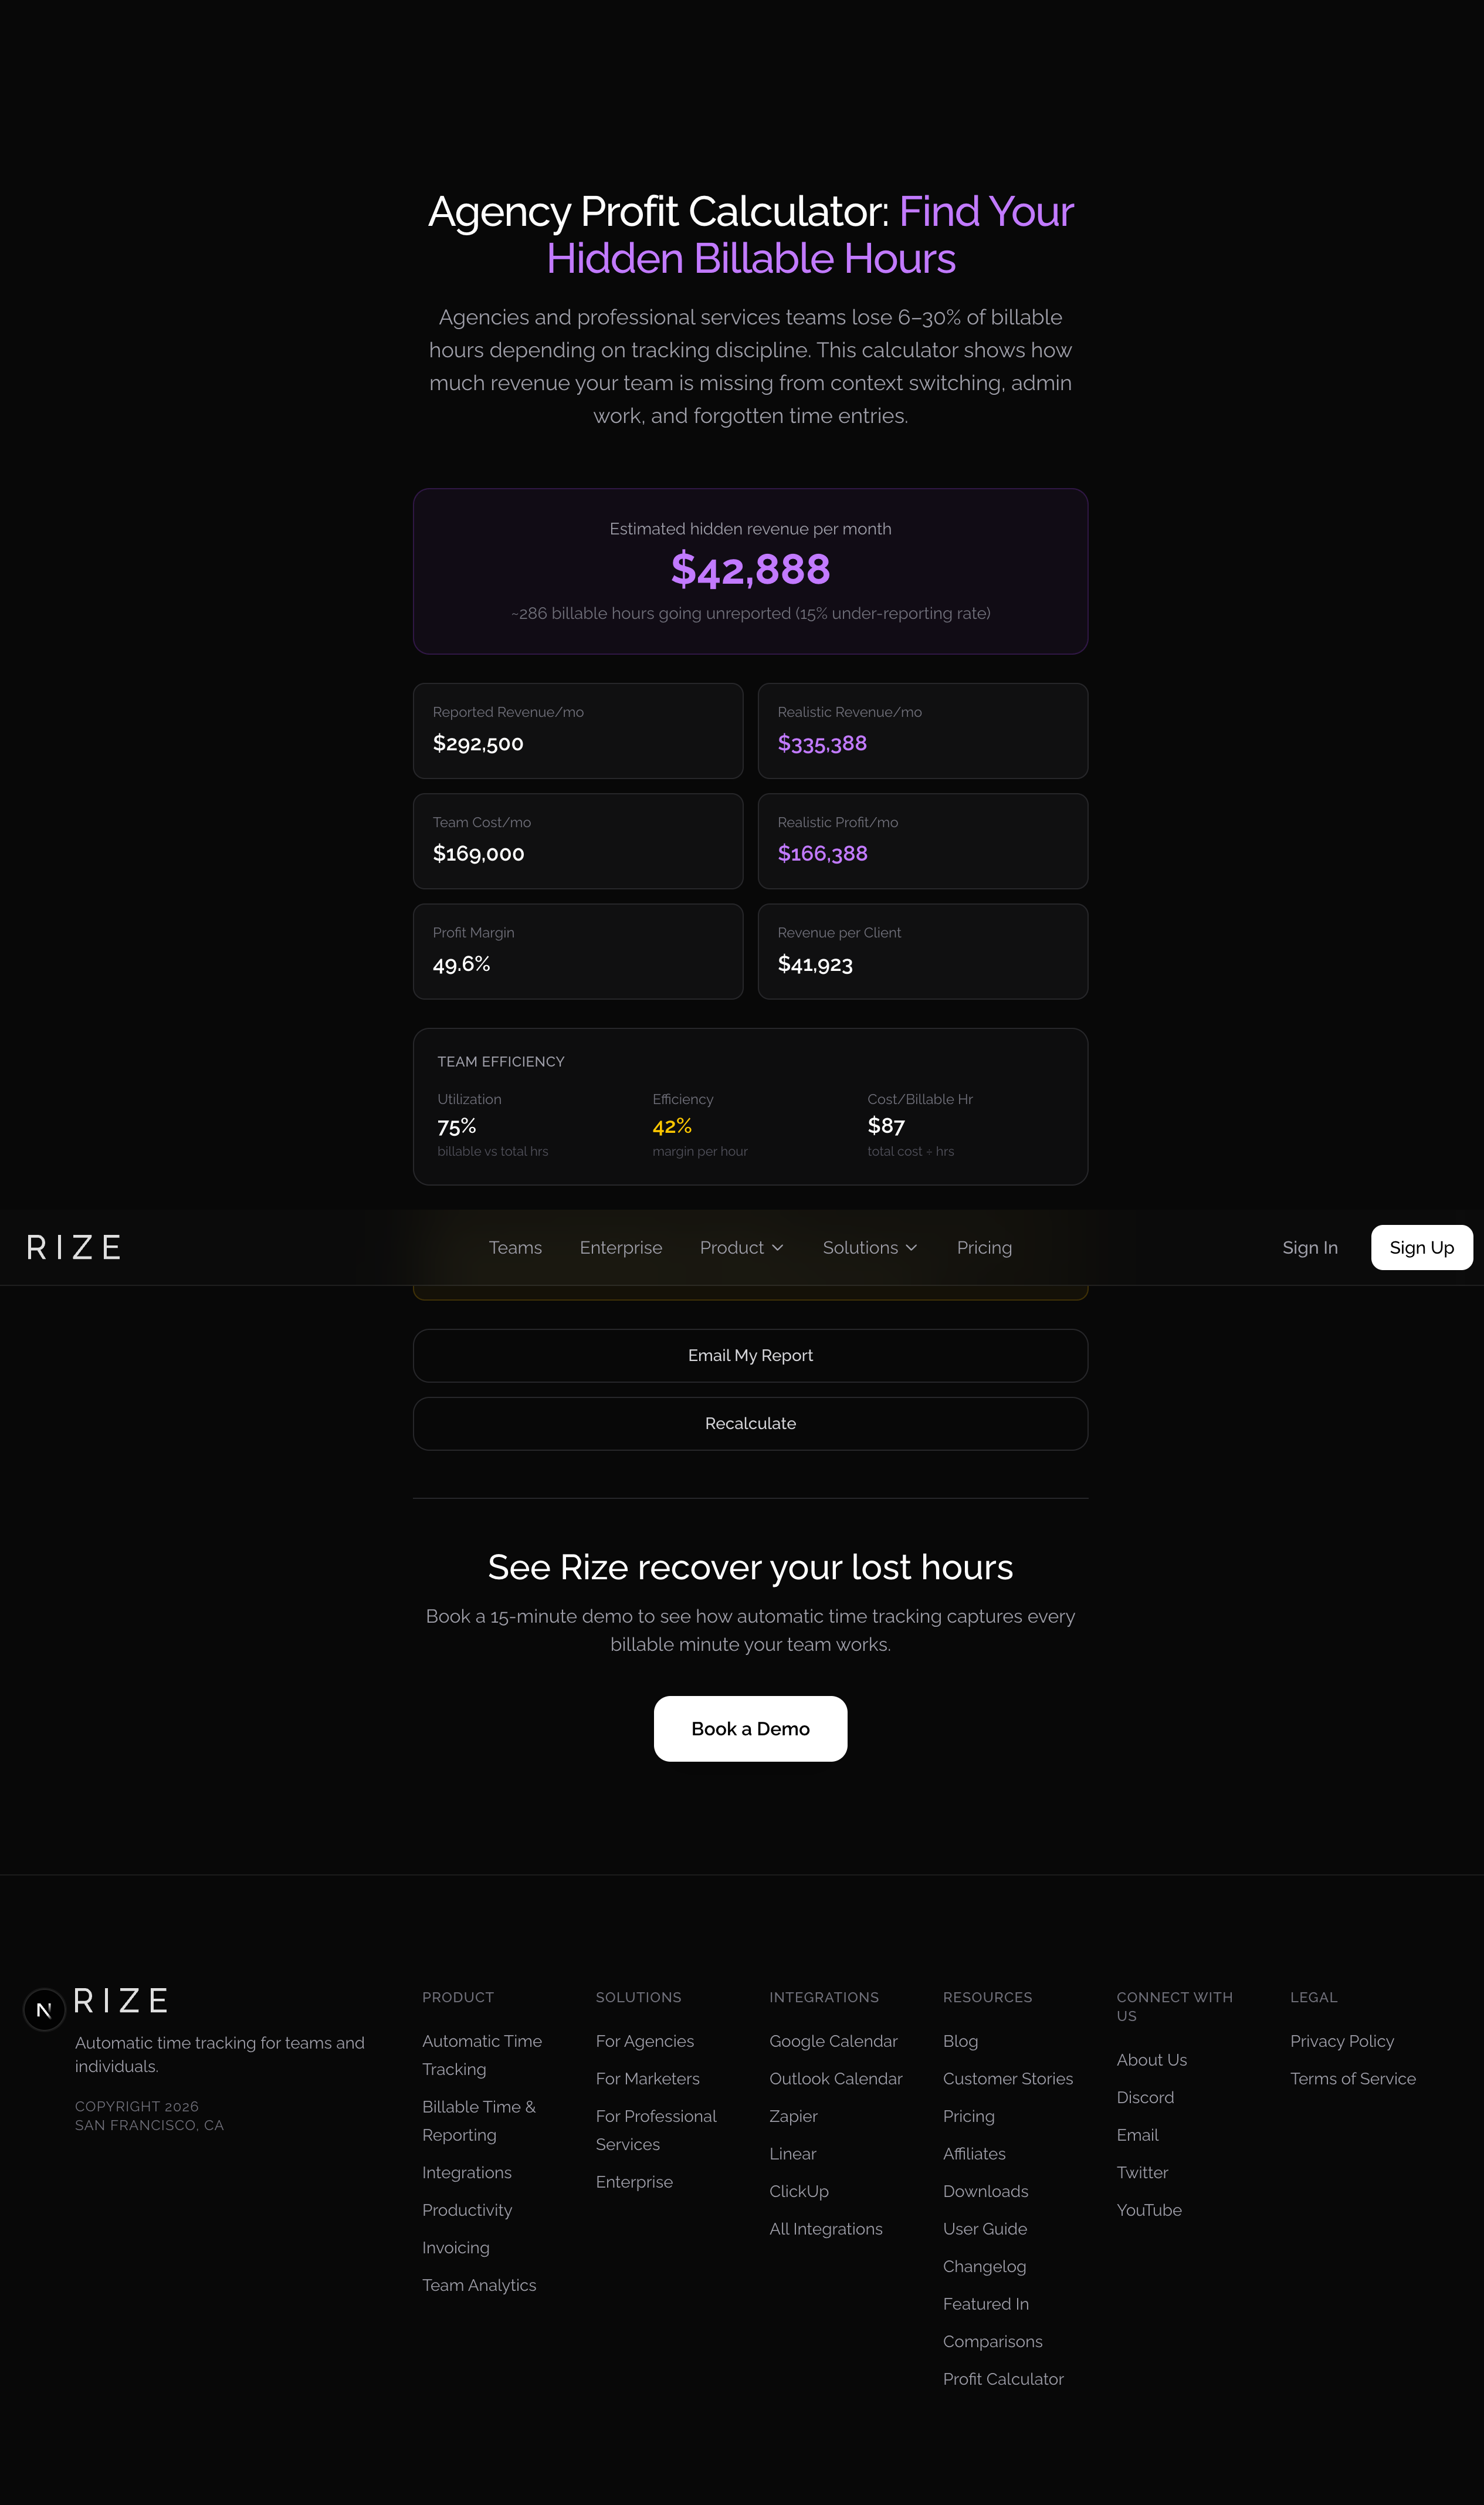
A team profitability calculator needs four inputs: project revenue, hours per team member, fully-loaded cost rates, and direct expenses. The formula is (revenue - total cost) / revenue. The hard part is accurate hours — Rize solves this by capturing time automatically so the formula runs on real data, not estimates.
Want to skip the spreadsheet?
Our free calculator estimates your hidden revenue loss in under 2 minutes.
Try the Profit CalculatorThis is the quiet reality for a lot of agencies and service teams. Revenue looks fine. Profits disappear somewhere between the estimate and the invoice. A team profitability calculator forces the math into the open so you can stop guessing and start managing margins with actual data.
What "Team Profitability" Actually Means
Team profitability isn't your company's overall profit margin. It's a measure of whether a specific team—or a specific project—generates more revenue than it costs. The formula sounds simple: revenue minus cost of delivery. But the "cost of delivery" part is where most agencies go wrong.
A fully-loaded cost calculation includes salary, payroll taxes (typically 7.65% for the employer's portion of FICA in the US), health insurance, paid time off, software subscriptions, and a share of overhead like rent and management time. Gallup research suggests that replacing one employee costs 50-200% of their annual salary, which means underpricing projects doesn't just hurt margins—it creates pressure that drives turnover.
Once you have fully-loaded costs, you can calculate your team's effective hourly cost rate. Divide annual fully-loaded cost by 2,080 billable hours (52 weeks × 40 hours). If a senior designer costs $120,000 all-in, their true cost to you is roughly $57.69 per hour. That's your floor for any work they do.
The Three Numbers You Need Before You Can Calculate Anything
Before you build a profitability model, you need three inputs: your team's fully-loaded hourly cost rate, your actual billable utilization rate, and the hours logged per project or client. Most agencies have the first number buried in payroll. Almost none have the second and third tracked accurately.
Billable utilization is the percentage of available work hours your team actually bills to clients. Industry benchmarks for agencies typically land between 65-75%. If your designers are billing 50 hours a month but working 160, you're absorbing 110 hours of cost with no corresponding revenue. Multiply that across a team of five and you're looking at 550 uncaptured hours every month.
The hours-per-project number is where tracking gets uncomfortable. Teams consistently underestimate how long projects take. A 2021 study by the Project Management Institute found that only 43% of projects are completed on time and within budget. Part of that is scope creep. A bigger part is that nobody tracked where the time actually went.
Start tracking time automatically
Join thousands of professionals who stopped guessing where their time goes. Free for 7 days.
Start Free TrialBuilding a Team Profitability Calculator in Practice
Here's the calculation you want to run for each project or retainer:
- Project revenue: What you billed or will bill the client.
- Team hours spent: Total hours from all team members, broken down by person.
- Fully-loaded cost per hour: Each person's annual cost ÷ 2,080.
- Total labor cost: Hours × cost rate for each person, summed.
- Direct expenses: Software, contractors, stock assets, anything bought for this project.
- Gross profit: Revenue minus labor cost minus direct expenses.
- Gross margin: Gross profit ÷ revenue × 100.
Target margins vary by agency type, but a common benchmark is 50-60% gross margin on project work before accounting for overhead. If you're running below 40%, you're likely either underpricing, underestimating scope, or both.
Worked Example: Web Design Project
| Line Item | Amount |
|---|---|
| Project revenue (billed to client) | $18,000 |
| Senior designer: 60 hrs × $57.69/hr | $3,461 |
| Developer: 80 hrs × $48.08/hr | $3,846 |
| Project manager: 20 hrs × $43.27/hr | $865 |
| Direct expenses (stock photos, hosting) | $340 |
| Total delivery cost | $8,512 |
| Gross profit | $9,488 |
| Gross margin | 52.7% |
At 52.7%, this project is in healthy territory. But if the team actually spent 200 hours instead of the 160 logged — common with manual tracking — the real margin drops to 38.4%. Momentum Studio found that closing this tracking gap drove a 15% increase in project profitability across their client portfolio. The projects didn't change; the data did.
Gross Margin Benchmarks by Agency Type
| Agency Type | Target Margin | Key Risk |
|---|---|---|
| Project-based (design, dev) | 50-60% | Scope creep on fixed bids |
| Retainer (SEO, content) | 55-65% | Over-servicing to retain clients |
| Consulting (strategy, advisory) | 60-70% | Senior time priced below market |
| Hybrid (mixed deliverables) | 45-55% | Cross-subsidizing unprofitable work |
Build this as a spreadsheet with a row per project—or use our free profit calculator to run the numbers instantly. Over time, you'll see patterns: which client types are actually profitable, which project types consistently blow scope, which team members are being priced too low relative to their cost. The data tells you where to raise rates and where to get tighter on estimates.
Why Time Tracking Data Is the Weak Link in Most Profitability Models
The math isn't the hard part. Getting accurate hours data is. Manual time tracking has a well-documented accuracy problem. When people track time in blocks at the end of a day, they consistently undercount actual hours worked. Forgotten timers, rounded durations, and skipped short tasks all compound. At the end of a week, the error grows further.
Think about what that means for your profitability model. If a project cost you 120 hours but your team only logged 95, you're overestimating your margin by 25 hours of labor cost. That might be the difference between a 55% margin and a 40% margin on the same project.
Momentum Studio, a 12-person creative agency, saw exactly this problem. After switching to automatic tracking, they measured a 15% increase in project profitability — not from billing more, but from finally seeing where hours were actually going. As founder Ben Jackson put it: "I'm a trusting leader, but I don't even trust myself to remember what I worked on two days ago. So how can I expect my designers to?"
This is where automatic time tracking changes the calculation. Rize tracks time automatically in the background based on which apps and sites your team is actually working in—Figma, Notion, Google Docs, Zoom, Slack—without anyone having to start a timer or fill in a timesheet. The data you get reflects what actually happened, not what someone remembered happening on Friday afternoon.
When your hours data is accurate, your profitability model is accurate. You stop pricing based on what you hope a project will take and start pricing based on what projects like it actually cost. This is why we made profitability reporting a core part of Rize's team dashboard. Most agencies only discover a project lost money weeks after delivery, when the invoice is already sent. We think you should know while there's still time to course-correct.
Common Margin Killers That Don't Show Up in Your Estimates
Even teams that track time carefully miss costs that silently eat margins. The biggest one is internal meetings. A 60-minute all-hands with seven people costs you seven hours of billable capacity. If your team has four hours of internal meetings per week per person, that's 20% of a 40-hour week that can't be billed—and most agencies don't price that overhead into their rates.
Revision rounds are the other major culprit. An initial estimate might assume one round of client feedback. The actual project runs three. Each round might add 8-12 hours of work that isn't captured in the contract. Over a year, revision creep can represent 10-15% of your total labor hours going unbilled.
Context switching also carries a real cost that rarely gets accounted for. A designer who moves between three client projects in a day loses roughly 23 minutes of productive time per switch, according to research from the University of California Irvine. That's not time they'll log anywhere, but it shows up as reduced output per hour—which means projects take longer than they should.
Hidden Cost Impact by Category
| Margin Killer | Typical Impact | How to Detect |
|---|---|---|
| Internal meetings | 20% of work week | Track Zoom/Google Meet time per person |
| Revision rounds (unscoped) | 8-12 hrs per round | Compare estimated vs actual hours per project |
| Context switching | 23 min lost per switch | Monitor app-switching frequency |
| Manual time tracking error | 20%+ billable time missed* | Compare auto-tracked vs logged hours |
| Scope creep (unbilled) | 10-15% of annual hours | Track hours per project phase vs contract |
*Based on Momentum Studio's experience: their team recovered 20% more billable time after switching from manual tracking to Rize.
Once you have visibility into where time actually goes, these patterns become visible. You can see which projects run long, which clients generate revision cycles, and where your team is losing time to context switching. Budgeting team time effectively starts with knowing what you're actually working with.
What to Do When Your Margin Is Below Target
If you run this calculation and find you're below your target margin, you have three levers. Most agencies default to raising rates, but that's often the hardest lever to pull without risking client churn. Here's the order that usually works better:
- Tighten scoping first. If a specific project type consistently runs 20% over estimated hours, add a 20% buffer to your estimate or define scope exclusions explicitly in your contract. Both protect margin without renegotiating rates.
- Shift work to the right rate tier. If a $150/hour principal is doing work a $75/hour associate could handle, you're spending twice as much on that output. Profitability data surfaces this — you can see which team members are consistently working below their rate tier on specific tasks.
- Raise rates last. When you have accurate cost data to justify the increase, the conversation with clients is grounded in specifics rather than a general "we need to charge more."
For teams using Rize, the activity data gives managers a concrete view of how team time is distributed across projects and task types. That makes it possible to have specific conversations about workload allocation rather than operating on instinct.
Start Tracking Before You Build the Model
The fastest way to build a working profitability calculator is to start with one month of clean time data. Run the calculation on the projects that closed in that month, using actual hours from automatic tracking rather than estimated or self-reported hours. You'll likely find two or three projects that looked profitable but weren't—and that data is what changes how you estimate and price going forward.
Rize gives your team automatic time data from day one, categorized by project type and application, without manual entry. Review current pricing and start a free 7-day trial — you will have a full month of accurate data in hand before you need to make your next pricing decision.
See what your team is leaving on the table
Enter your team size, rates, and tracking method. The calculator does the rest.
Open the Profit CalculatorStart tracking time automatically
Join thousands of professionals who stopped guessing where their time goes. Free for 7 days.
“Rize has been a no-brainer for me.” — Ali Abdaal Read more →
Frequently Asked Questions
How do you calculate team profitability?
Team profitability is calculated by subtracting total delivery cost (team hours × fully-loaded hourly rate, plus direct project expenses) from project revenue. The resulting gross profit divided by revenue gives you gross margin. A healthy agency margin typically falls between 50-60% on project work before overhead.
What is a fully-loaded cost rate and why does it matter?
A fully-loaded cost rate includes an employee's salary plus payroll taxes, benefits, paid time off, and a share of overhead costs like software and management time. Using salary alone underestimates true cost by 25-40%, which leads to underpriced projects and margin that disappears on delivery.
What billable utilization rate should an agency target?
Most agencies target 65-75% billable utilization. Below 60%, the team is absorbing too many non-billable hours—internal meetings, admin, business development—without pricing that overhead into client rates. Above 80%, teams tend to burn out and quality suffers.
Why is manual time tracking a problem for profitability calculations?
Manually logged time consistently undercounts actual hours worked — people forget timers, round durations, and skip short tasks. When hours data is inaccurate, profitability calculations based on that data are also inaccurate — often showing better margins than actually exist, which leads to systematic underpricing over time.
What are the most common reasons agency project margins fall below target?
The most common causes are untracked revision rounds, underestimated project scope, internal meeting overhead that isn't priced into rates, and context-switching costs that reduce effective output per hour. Projects consistently running over estimate by 20% or more usually indicate a scoping or tracking problem rather than a pricing problem.


