Agency profitability is the difference between what you bill and what it actually costs to deliver the work. Most agencies guess at this number because their time data is wrong. According to SPI (Service Performance Insight) research on professional services benchmarks, firms with billable utilization below 60% average net margins of 8-12%, while those above 70% achieve 18-22%. The gap is almost entirely explained by time data accuracy. If your team logs time manually, you are working with incomplete data and making pricing decisions on margins that don't reflect reality. Automatic time tracking tools like Rize close this gap by capturing every work session in the background, feeding per-client profitability dashboards with actual hours instead of estimates.
What Is Agency Profitability Tracking?
Agency profitability tracking is the practice of measuring the true cost of delivering client work against the revenue that work generates. It combines time data, cost rates, project budgets, and overhead allocation to show which clients, projects, and team members make you money and which ones don't.
This goes beyond simple revenue reporting. A client paying you $15,000 per month looks healthy until you discover your team spent 240 hours on their work at a blended cost of $75 per hour. That is $18,000 in delivery cost on a $15,000 retainer. Without accurate time data, you won't catch this until year-end accounting, if you catch it at all.
According to Deltek Clarity research on architecture, engineering, and consulting firms, the top financial challenge for professional services organizations is improving project profitability. The firms that solve it share one trait: they track time at the task level and review margins during the project, not after.
The Five Metrics That Drive Agency Profitability
Five metrics separate profitable agencies from those that are busy but broke. Each one depends on accurate time data as its foundation.
| Metric | Formula | Benchmark | Why It Matters |
|---|---|---|---|
| Gross margin per client | (Revenue - Direct Cost) / Revenue | 50-60% | Shows which clients actually make you money |
| Billable utilization | Billable Hours / Available Hours | 65-75% | Signals revenue capacity and staffing efficiency |
| Effective bill rate | Actual Revenue / Hours Worked | 2.5-3x cost rate | Reveals scope creep and write-offs |
| Project burn rate | (Hours Spent x Cost) / Budget | Track weekly | Catches overruns before they eat your margin |
| Revenue concentration | Top 3 Clients / Total Revenue | Below 40% | Measures dependency risk |
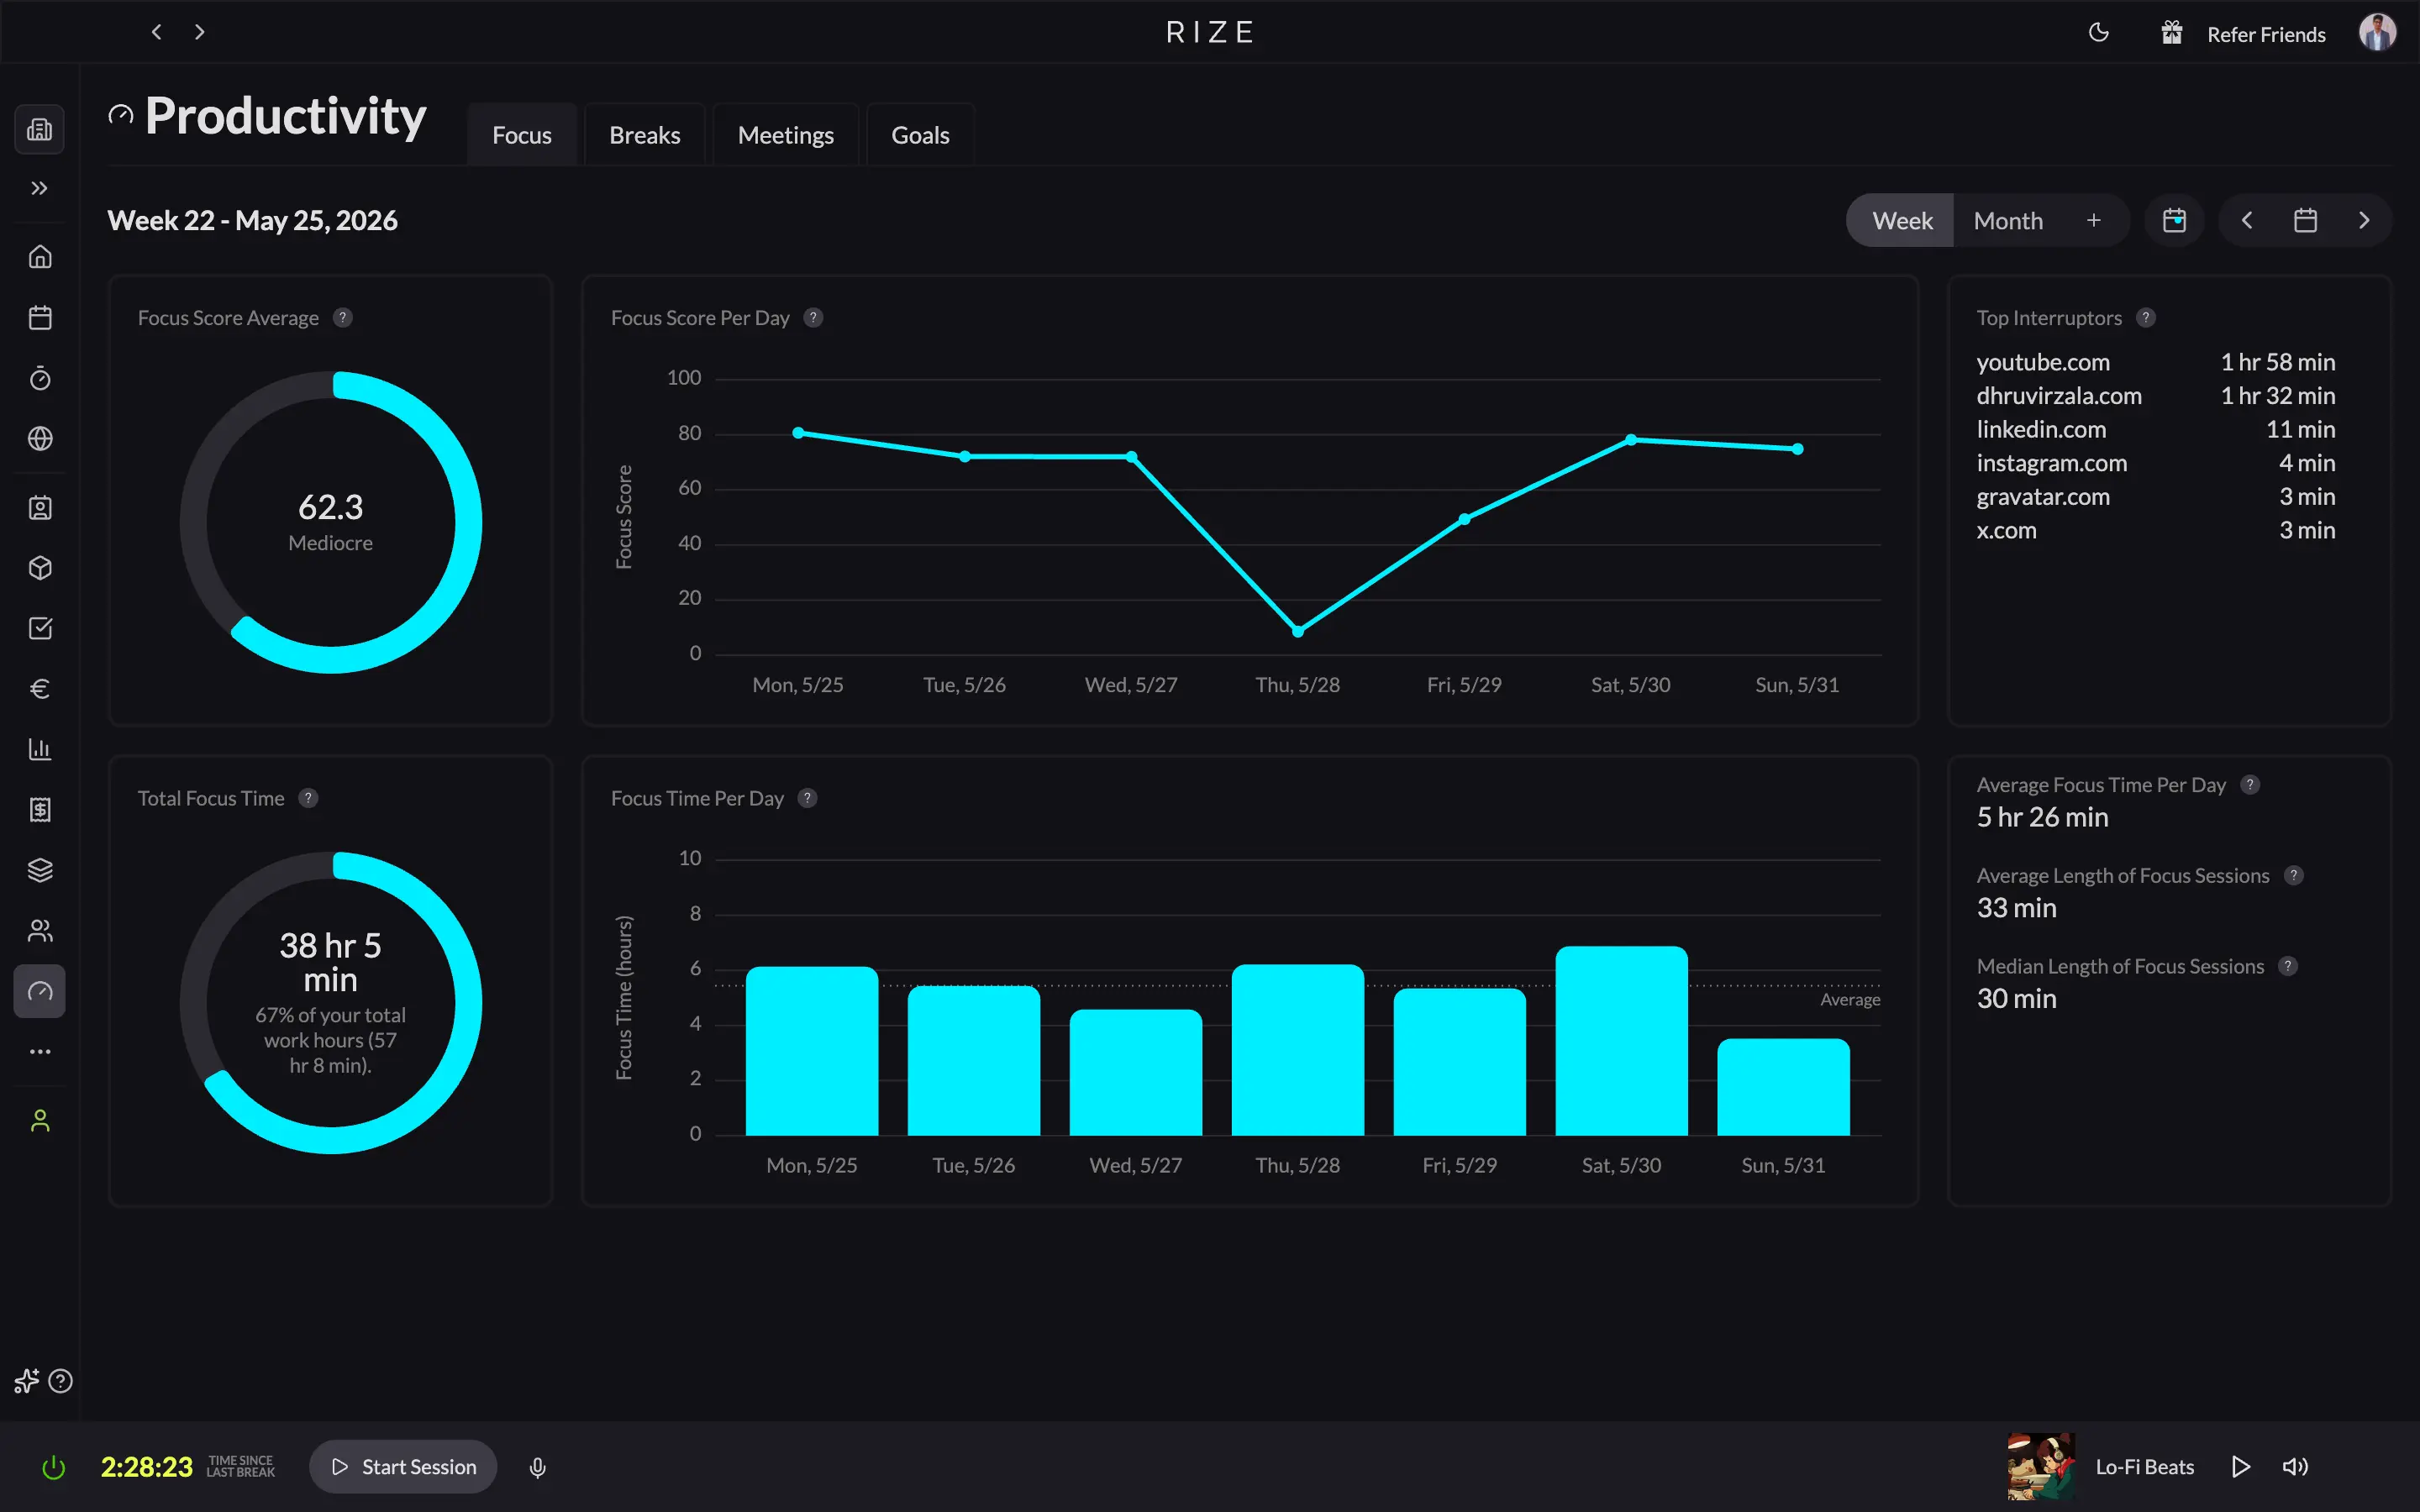
SPI's Professional Services Maturity Benchmark consistently shows that utilization is the single strongest predictor of agency profitability. A 5-point increase in utilization (say, from 65% to 70%) translates directly to margin improvement because you are generating more revenue from the same fixed-cost base.
The problem is that utilization calculated from manual timesheets is almost always inflated. Your team rounds up, skips non-billable entries, and forgets short tasks. The "70% utilization" on your dashboard might be 58% in practice. That 12-point gap is the difference between a healthy margin and breaking even.
Start tracking time automatically
Join thousands of professionals who stopped guessing where their time goes. Free for 7 days.
Start Free TrialWhy Manual Time Tracking Destroys Agency Margins
Manual timesheets are the primary source of margin error in agency finance. The problem is not that people lie. It is that human memory is unreliable, and every gap between reality and the logged hours distorts your profitability picture.
The data loss happens in predictable ways. Short tasks under 15 minutes go unlogged. Context switches between clients blur which project got the time. Designers and developers batch their time entries at the end of the week, reconstructing from memory. Ben Jackson, CEO of Momentum Studio, a 12-person creative agency, described the problem directly: "I don't trust myself to remember what I worked on two days ago. So how can I expect my designers to?"
Momentum Studio had been using Harvest for time tracking. The issue was not Harvest's features. It was that designers forgot to start and stop timers. After switching to Rize's automatic time tracking, they recovered 20% more billable time and saw a 15% increase in project profitability. Eight hours per week of admin time disappeared because nobody had to fill out timesheets anymore.
At Impulse Lab, a 6-person product studio, the impact showed up differently. Leonard Roussard, the founder, put it this way: "We use Rize to know: 'We spent 30 hours on this client and got this result.' That's powerful when you're working lean and launching quickly." His team reports 98% billing accuracy and 5x faster client reporting since adopting automatic tracking.
How to Calculate Per-Client Profitability
Per-client profitability is the most actionable metric an agency can track. Here is the formula, step by step.
Step 1: Calculate fully-loaded cost rate per team member. Take annual salary, add benefits (typically 20-30% of salary), employer payroll taxes (7.65% FICA), and allocate a share of overhead (rent, tools, management time). Divide by annual available hours (typically 1,800-2,000). A designer earning $85,000 with benefits and overhead might cost $55-65 per hour fully loaded.
Step 2: Capture actual hours per client. This is where most agencies fail. If your team logs time manually, you are working with a number that understates reality by 15-40%. Automatic time tracking captures every work session and categorizes it by client and project without timers or manual entry.
Step 3: Calculate delivery cost. Multiply each team member's hours on the client by their fully-loaded rate. Sum across the team. Add any direct project expenses (contractors, stock assets, software licenses).
Step 4: Compare against revenue. Client margin = (Client Revenue - Total Delivery Cost) / Client Revenue x 100. A healthy client should be at 50-60% gross margin. Below 40% needs immediate attention. Below 20% means you are subsidizing that client with profit from others.
The Rize profit calculator automates this math. You enter team size, billing rates, and cost rates. It shows how much revenue you are leaving on the table from untracked hours.
Agency Profitability Tool Comparison: Rize vs Harvest vs Scoro vs Productive.io vs Kantata
Not every time tracking tool is built for agency profitability. Here is how the leading options compare on the features that matter for margin visibility.
| Feature | Rize | Harvest | Scoro | Productive.io | Kantata |
|---|---|---|---|---|---|
| Time capture method | Automatic (background) | Manual timers | Manual timers | Manual timers | Manual timers |
| Per-client profitability | Built-in dashboards | Basic (via reports) | Built-in dashboards | Built-in dashboards | Built-in dashboards |
| Utilization tracking | Automatic | Manual | Manual | Manual | Manual |
| Project burn rate | Real-time | Budget vs actuals | Real-time | Real-time | Real-time |
| AI categorization | Yes (auto-tags) | No | No | No | No |
| Resource planning | Workload view | Capacity reports | Gantt + resource planner | Gantt + resource planner | Full PSA suite |
| Built-in invoicing | No (export to QuickBooks/Xero) | Yes | Yes | Yes | Yes |
| Privacy-first (no screenshots) | Yes | Yes | Yes | Yes | Yes |
| Pricing (per seat/month) | $16.99 | $10.80 | $26+ | $9+ | Custom |
Rize is the only tool on this list that captures time automatically. Every other option requires your team to start and stop timers or log hours after the fact. For agencies where the primary profitability problem is data accuracy, that difference is decisive. If your team already logs time reliably and you need full PSA features (resource planning, invoicing, CRM), Scoro or Kantata covers more of the workflow. If you need a lightweight timer with invoicing built in, Harvest is solid. But if your margin numbers are wrong because your time data is incomplete, Rize solves the root cause.
See how Rize fits your team at /pricing, or explore the project profitability features in detail.
Utilization Rate Benchmarks: What Good Looks Like
Billable utilization is the percentage of available hours spent on billable client work. It is the single most important operational metric for agency profitability.
According to SPI's Professional Services Maturity Benchmark, the industry average for billable utilization across professional services firms hovers around 68-72%. Promethean Research, which tracks agency-specific benchmarks, reports that top-quartile creative agencies hit 75-80% utilization while maintaining quality.
| Utilization Range | What It Signals | Action |
|---|---|---|
| Below 55% | Overstaffed or too much non-billable work | Audit time allocation; reduce internal meetings |
| 55-65% | Below average; margin pressure likely | Identify non-billable time sinks; improve scoping |
| 65-75% | Healthy range for most agencies | Maintain; optimize project mix |
| 75-80% | Top-quartile performance | Watch for burnout signals; protect quality |
| Above 85% | Burnout risk; no room for growth work | Hire or reduce scope before quality drops |
A critical nuance: utilization targets differ by role. Strategists and account managers typically run at 50-60% utilization because relationship management and planning are core to their role but not directly billable. Designers and developers should be closer to 75-80%. Applying a blanket target across all roles creates misleading performance signals.
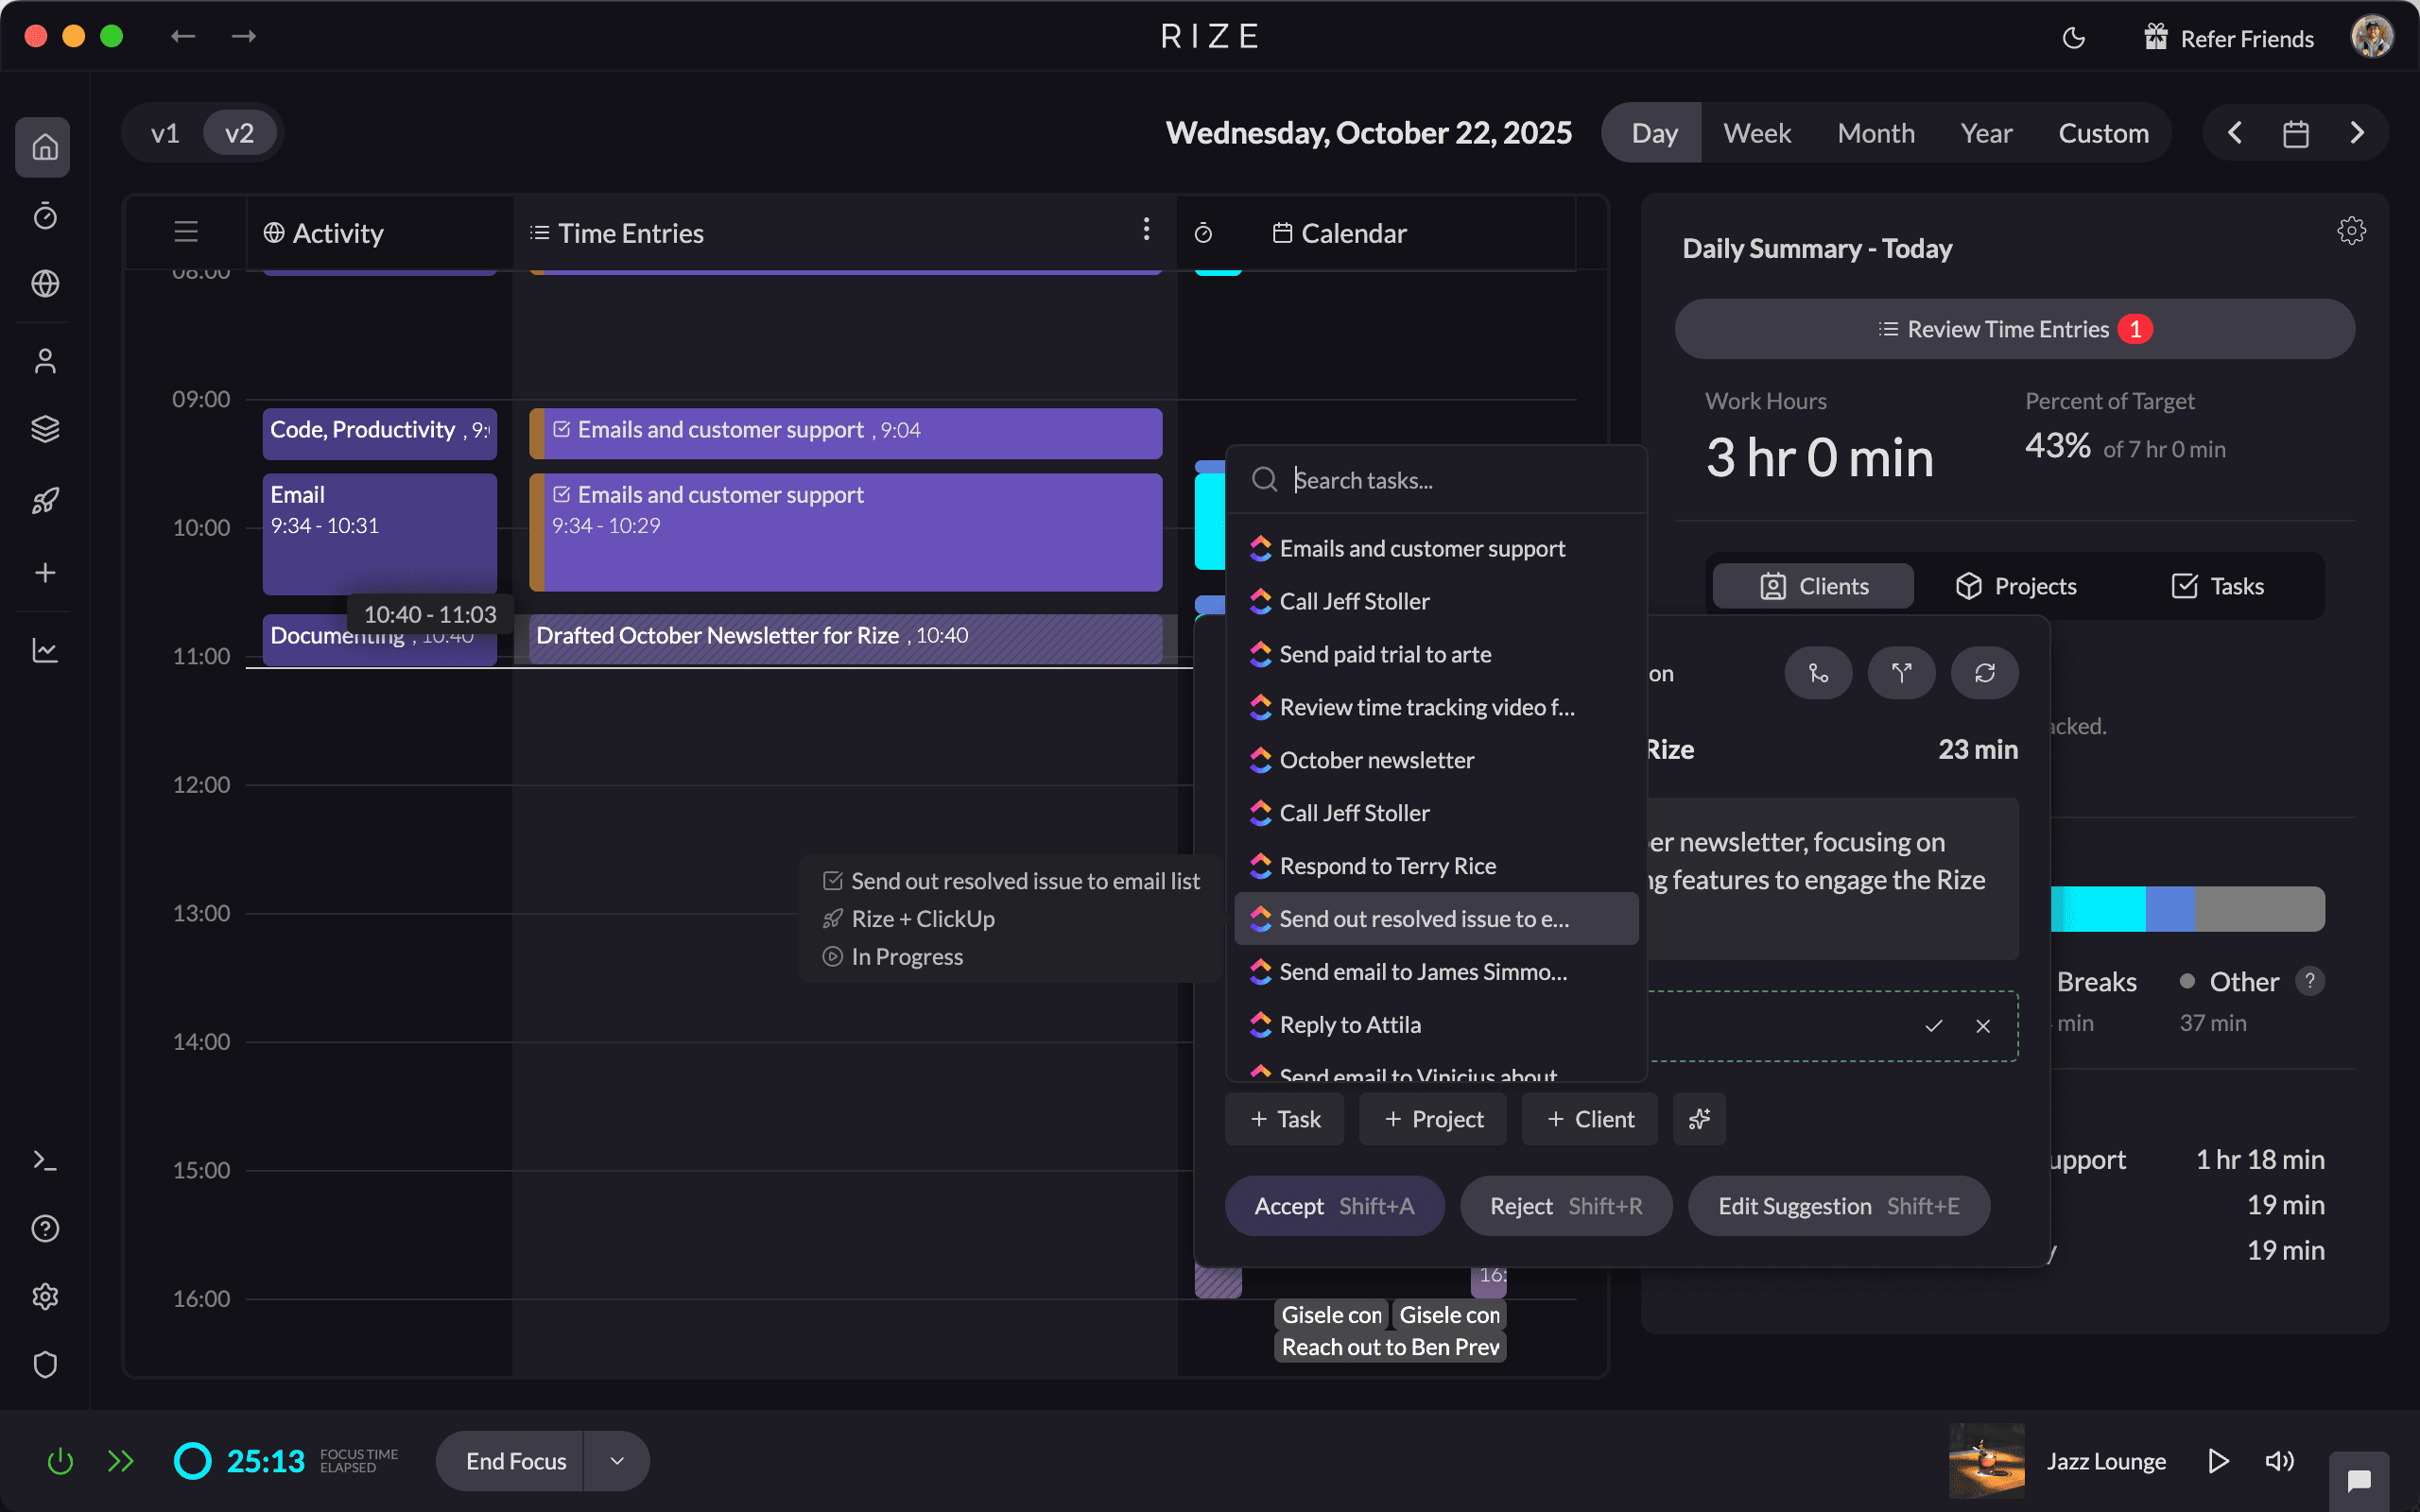
Rize tracks utilization automatically by categorizing every work session as billable or non-billable based on project and client assignments. You set the targets per team member; the dashboards show where you stand in real time without anyone filling out a form.
How to Spot Unprofitable Clients Before They Drain Your Margin
Most agencies have at least one client that costs more to serve than it generates in revenue. The challenge is identifying which one before year-end accounting exposes the damage.
Three warning signs surface in time data. First, actual hours consistently exceed estimated hours by more than 20%. This means your scoping process is broken for that client type, or the client's revision cycles are absorbing unplanned time. Second, your effective bill rate (revenue divided by actual hours) drops below your blended cost rate. This means you are losing money on every hour delivered. Third, non-billable hours on the account (internal meetings, scope discussions, context switching) exceed 30% of total time spent. That overhead ratio makes profitability nearly impossible at standard rates.
Ben Jackson at Momentum Studio caught exactly this pattern. After deploying Rize, they discovered certain clients consumed 35% more hours than the retainer covered. With that data visible in real time, they renegotiated scope or adjusted pricing before the relationship became unsustainable. "Rize allows my team to get deep into work and go where their creativity leads them without really having to think about time tracking," Jackson said, describing how the switch eliminated the friction between creative work and financial accountability.
See how other agencies have solved this problem in our customer stories.
Project Burn Rate: The Early Warning System
Project burn rate is the percentage of budget consumed relative to project completion. It is the earliest indicator that a project is heading toward a loss.
The formula is simple: (Hours Spent x Blended Cost Rate) / Total Project Budget x 100. Compare that percentage against your estimated percentage of completion. If you have burned 60% of the budget but the project is only 40% complete, you have a 20-point gap that will show up as a margin hit at delivery.
The Deltek Clarity study found that project overruns are the top driver of margin erosion in professional services. The firms that avoid this review burn rate weekly. They don't wait for the project to end to discover they lost money on it.
With Rize's project profitability dashboards, burn rate updates in real time as hours are captured. Managers can filter by project, see who is spending time where, and flag overruns before they compound. No end-of-week reconciliation. No asking people what they worked on. The data is already there.
Building a Profitability Review Cadence
Data only improves profitability if you act on it. Here is a review cadence that connects time data to margin decisions without adding overhead.
- Weekly (15 minutes): Review burn rate on active projects. Flag any project where budget consumption outpaces progress by more than 10 points. Check team utilization against targets and rebalance workloads if anyone is below 55% or above 85%.
- Monthly (30 minutes): Review per-client profitability. Identify your top 3 and bottom 3 clients by margin. For bottom-performing clients, decide whether to renegotiate scope, adjust rates, or phase out the relationship. Compare effective bill rates across client types.
- Quarterly (1 hour): Analyze profitability trends. Are margins improving or declining? Which services or client types deliver the best margins? Use this data to inform pricing changes, staffing plans, and business development priorities.
This cadence works because the underlying time data is captured automatically. If your team still fills out timesheets manually, you will spend more time chasing compliance than reviewing the numbers. That is the real cost of manual tracking: not just the lost billable hours, but the operational tax on every review, report, and margin decision built on incomplete data.
Getting Started: Three Steps to Better Profitability Tracking
You do not need to overhaul your entire agency management stack to improve profitability tracking. Start with these three changes.
1. Switch to automatic time capture. Remove the manual input step entirely. When time is captured in the background, adoption stops being a problem and data quality stops being a variable. Rize runs silently on each team member's device and categorizes time by client and project using AI. No timers, no end-of-day logging, no weekly compliance reminders.
2. Set cost rates and revenue targets per client. Load each team member's fully-loaded hourly cost rate into your tracking tool. Enter project budgets or retainer values. The math is straightforward once the inputs are accurate. Rize's team dashboards calculate margin in real time from these inputs.
3. Review margins weekly, not monthly. A monthly profitability review means you discover problems 4-6 weeks too late. Weekly burn rate checks take 15 minutes and catch scope creep, underestimation, and utilization gaps while there is still time to act.
Start a free 7-day trial and see your team's real utilization and per-client margins within the first week.
Start tracking time automatically
Join thousands of professionals who stopped guessing where their time goes. Free for 7 days.
“Rize has been a no-brainer for me.” — Ali Abdaal Read more →
Macgill Davis is cofounder of Rize, an automatic time tracker that improves focus and builds better work habits.