Rize tracks app and website usage automatically in the background. We pulled an anonymized, aggregated week of work activity from a sample of active users and ranked the apps by share of tracked work time. These are the top 10 apps that actually held people's attention for the week of Aug 10–16, 2026, not the most installed or most talked about.
Top 10 work apps by share of the workday
| Rank | App | Share of tracked work time |
|---|---|---|
| 1 | Claude | 5.8% |
| 2 | Google Chrome | 4.6% |
| 3 | YouTube | 4.5% |
| 4 | Slack | 3.5% |
| 5 | Google Docs | 3.0% |
| 6 | ChatGPT | 2.7% |
| 7 | Microsoft Teams | 2.1% |
| 8 | Gmail | 2.0% |
| 9 | Google Meet | 1.8% |
| 10 | Outlook | 1.7% |
Claude alone accounted for roughly 5.8% of all tracked work time. Google Chrome was second at about 4.6%. The ranking is based on hours actually spent, so tools that keep a session open win over tools that are opened for a quick lookup. That is why AI assistants and communication apps outrank browsers: they hold the active window for longer blocks.
The top app changes by plan
| Plan | #1 app by share | Share of tracked time |
|---|---|---|
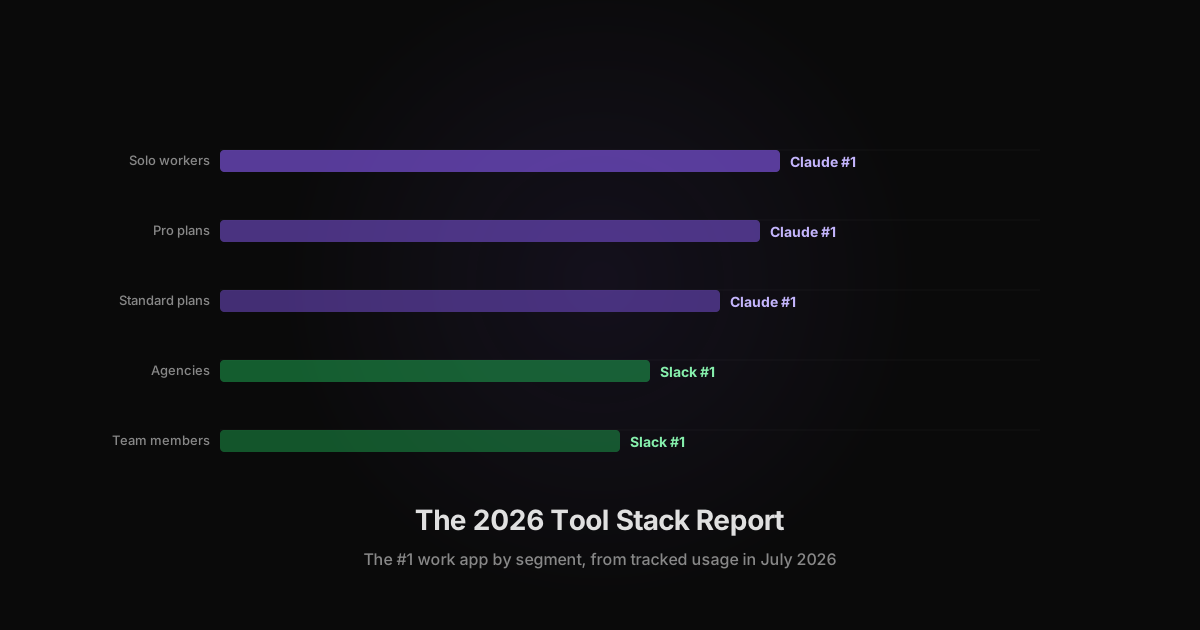
| agency | Slack | 7.7% |
| pro | Claude | 6.8% |
| standard | Claude | 6.2% |
Agency plans lean harder into coordination: Slack, Microsoft Teams, and Google Meet together can account for a large share of the measured workday. Pro and standard plans show more AI and production time, with Claude, ChatGPT, and Cursor near the top. The split is not about preference; it is about the shape of the work itself. Teams that spend their day in handoffs measure that time in communication apps. Solo workers and deep-work roles measure it in AI and document tools.
Why share of the workday matters
Most app rankings count downloads, signups, or survey responses. Those numbers describe availability, not use. Share of tracked time describes what was actually open and active during work. A tool with a high user count but low share is a utility. A tool with a low user count but high share is a primary workspace for the people who use it. That distinction matters when you are deciding which tools to standardize, which AI budgets to protect, and where shadow IT might be hiding.
This ranking also generalizes tool names so version numbers and domain variants do not split a single app into multiple rows. Claude desktop, claude.ai, and other variants are shown as separate entries only when they are meaningfully different surfaces; otherwise the noise is stripped out. The result is a cleaner picture of which apps are actually running the workday.
Trend: share of the workday over the last four weeks
Claude has held the #1 spot for 5 weeks, down 0.1 percentage points since Jul 13–19, 2026.
| App | Jul 13 | Jul 20 | Jul 27 | Aug 3 | Aug 10 |
|---|---|---|---|---|---|
| Claude | 6.0% | 6.0% | 6.3% | 6.4% | 5.8% |
| Google Chrome | 4.4% | 4.4% | 4.3% | 4.5% | 4.6% |
| YouTube | 4.2% | 4.1% | 3.8% | 4.1% | 4.5% |
| Slack | 3.5% | 3.6% | 3.7% | 3.6% | 3.5% |
| Google Docs | 3.0% | 2.8% | 3.0% | 3.1% | 3.0% |