A monthly burn report by department is the single most useful profitability artifact an agency produces — and the one most agencies get wrong by reporting account totals. Over-servicing concentrates in one or two departments, and an account-level number hides exactly where the margin is leaking. Here is the template, the cadence, and the data problem underneath it.
What the Report Is
Department burn = actual hours per client per department ÷ scoped hours for that department. Priced at loaded cost rates, it converts over-delivery into dollars of margin consumed.
Retainers are scoped in departments: creative gets X hours, strategy gets Y, social gets Z. Reporting burn at the account level averages away the part that matters — a retainer at "90% overall" with creative at 140% and strategy at 55% is a broken scope assumption, and only the department view shows it.
The Template
One row per client × department, six columns:
Scoped hours — what the retainer or fee assumed for that department this period.
Actual hours — delivered. (The hard column; see below.)
Burn % — actual ÷ scoped, compared against % of period elapsed.
Cost $ — actual hours × loaded rate per person. Senior time on junior-priced work shows up here, not in the hours column.
Margin $ — fee allocation for that department minus cost.
Flag — over 115% of pace, or effective rate below target two months running.
Agencies running this template typically find the same pattern: one or two departments carry the entire over-service burden, and it's usually the revision-heavy pod, not the account as a whole.
The Data Problem
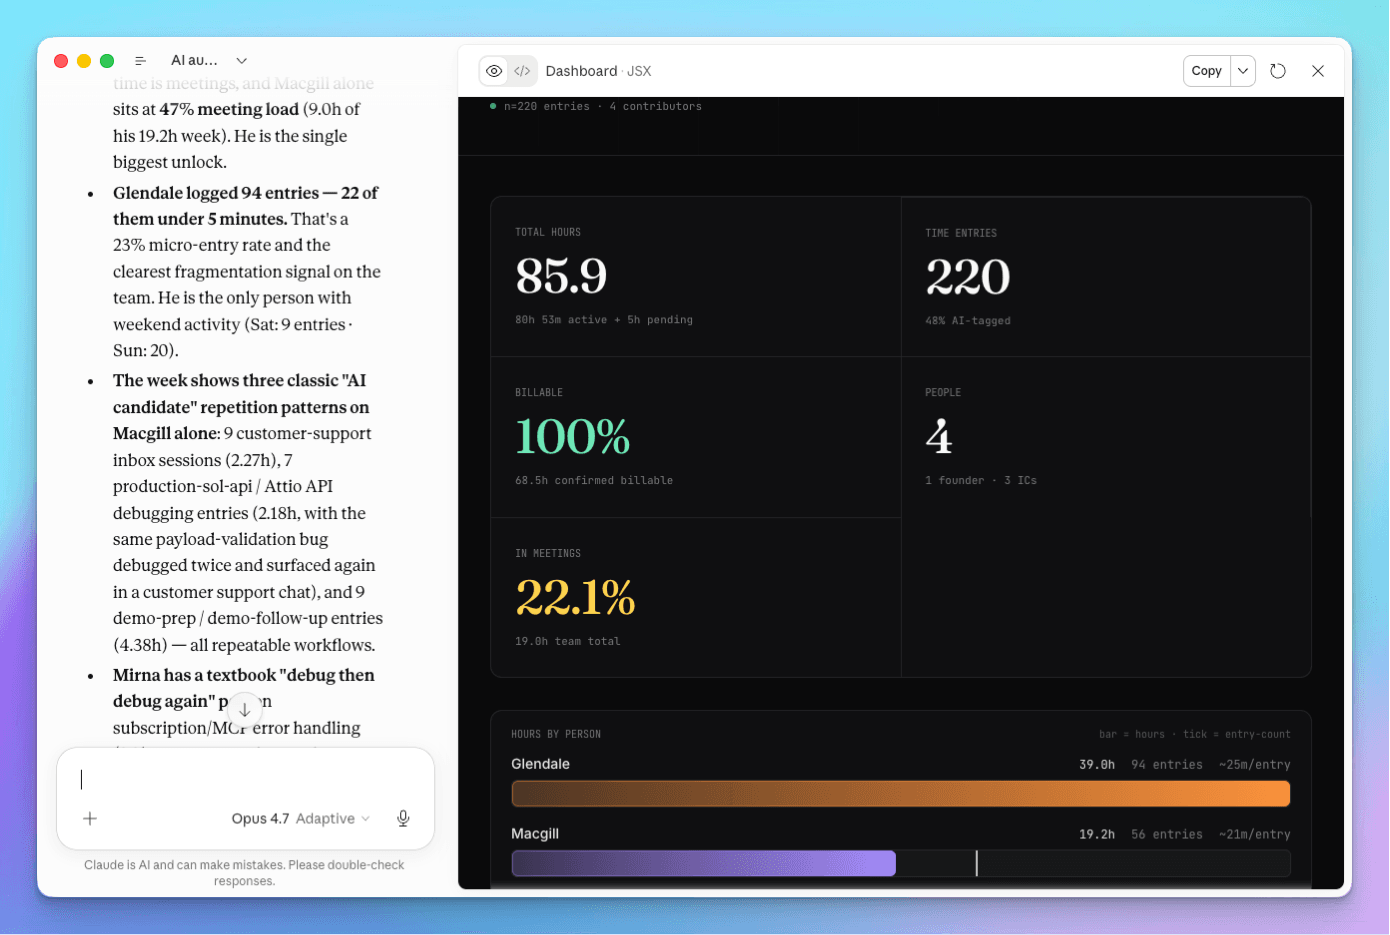
The template is easy. The hours are not. Manual timesheets miss the unscoped work that causes over-burn — the five-minute fix, the extra revision round, the internal sync that never gets logged. The report reads clean precisely where the leak is.
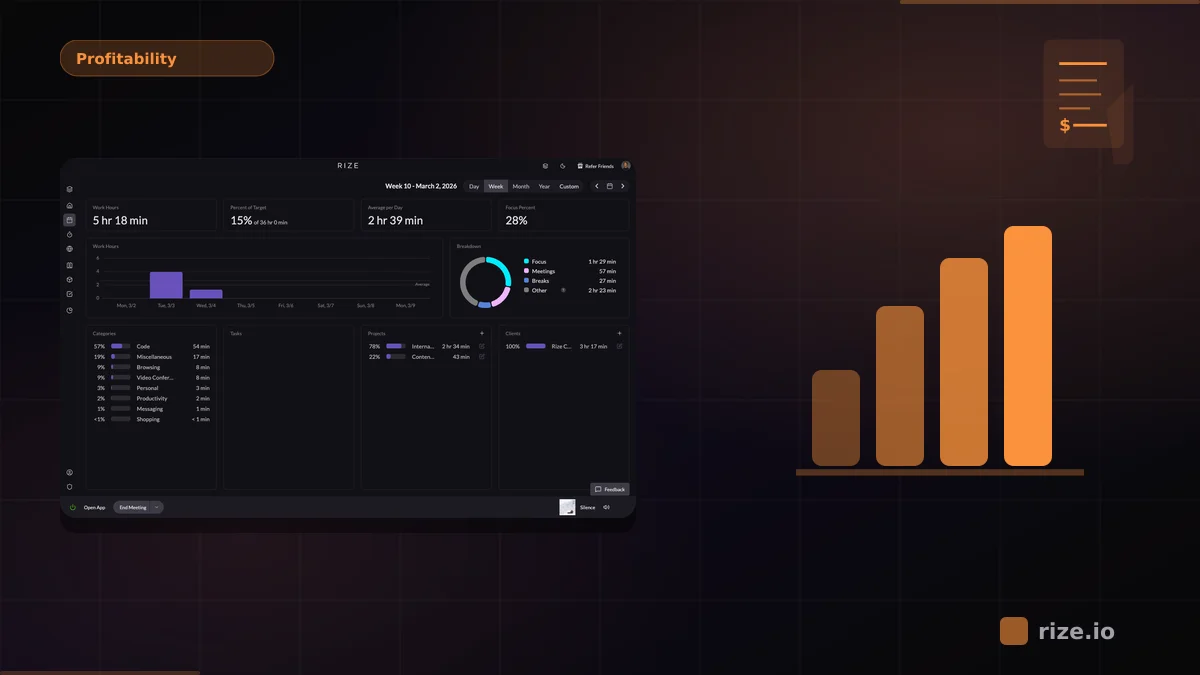
This is why agencies that take burn reporting seriously end up on automatic capture. Rize records every work session in the background and categorizes it to client and project — the department split comes from the work itself, not from someone remembering to tag a timer.
The Cadence
Weekly — account managers review their accounts' department burn. A department at 130% of scope pace in week two still has a fix available: a scope conversation, a paused deliverable, a change order.
Monthly — leadership reviews the full client × department grid with cost and margin columns, and the two flags (over-pace departments, declining effective rates). This is the meeting where repricing and re-scoping decisions actually happen.
At renewal — the burn history becomes the pricing evidence. "Here is where the hours went across creative and strategy" is a conversation about scope; "we'd like to charge more" is a negotiation about nothing.
Common Mistakes
Account-level totals only. The average hides the leak. Always split by department — the fix is departmental, so the diagnosis has to be.
Hours without cost. 10 hours of partner time and 10 hours of intern time are not the same burn. Cost at loaded rates or the number is decorative.
Monthly-only reviews. Burn found at month-end is already spent margin. Weekly at the account level is the minimum cadence that lets anyone act on it.
No action threshold. Define the tripwires up front — over 115% of pace, effective rate below target — or the report becomes a ritual nobody responds to.
Burn reporting works when the hours behind it are real. If your report still depends on the team logging time, it's measuring their memory, not their work. See how Rize reports burn by client and department, or read the retainer burn tracking guide.