Ask an agency owner how their week splits between client work and “everything else,” and you'll usually get a confident answer. Something like “we're probably 70/30, maybe 75/25 on a good week.”
Then you look at the actual time data, and that number falls apart. Primarily because most teams aren't tracking time in a way that could ever produce it in the first place.
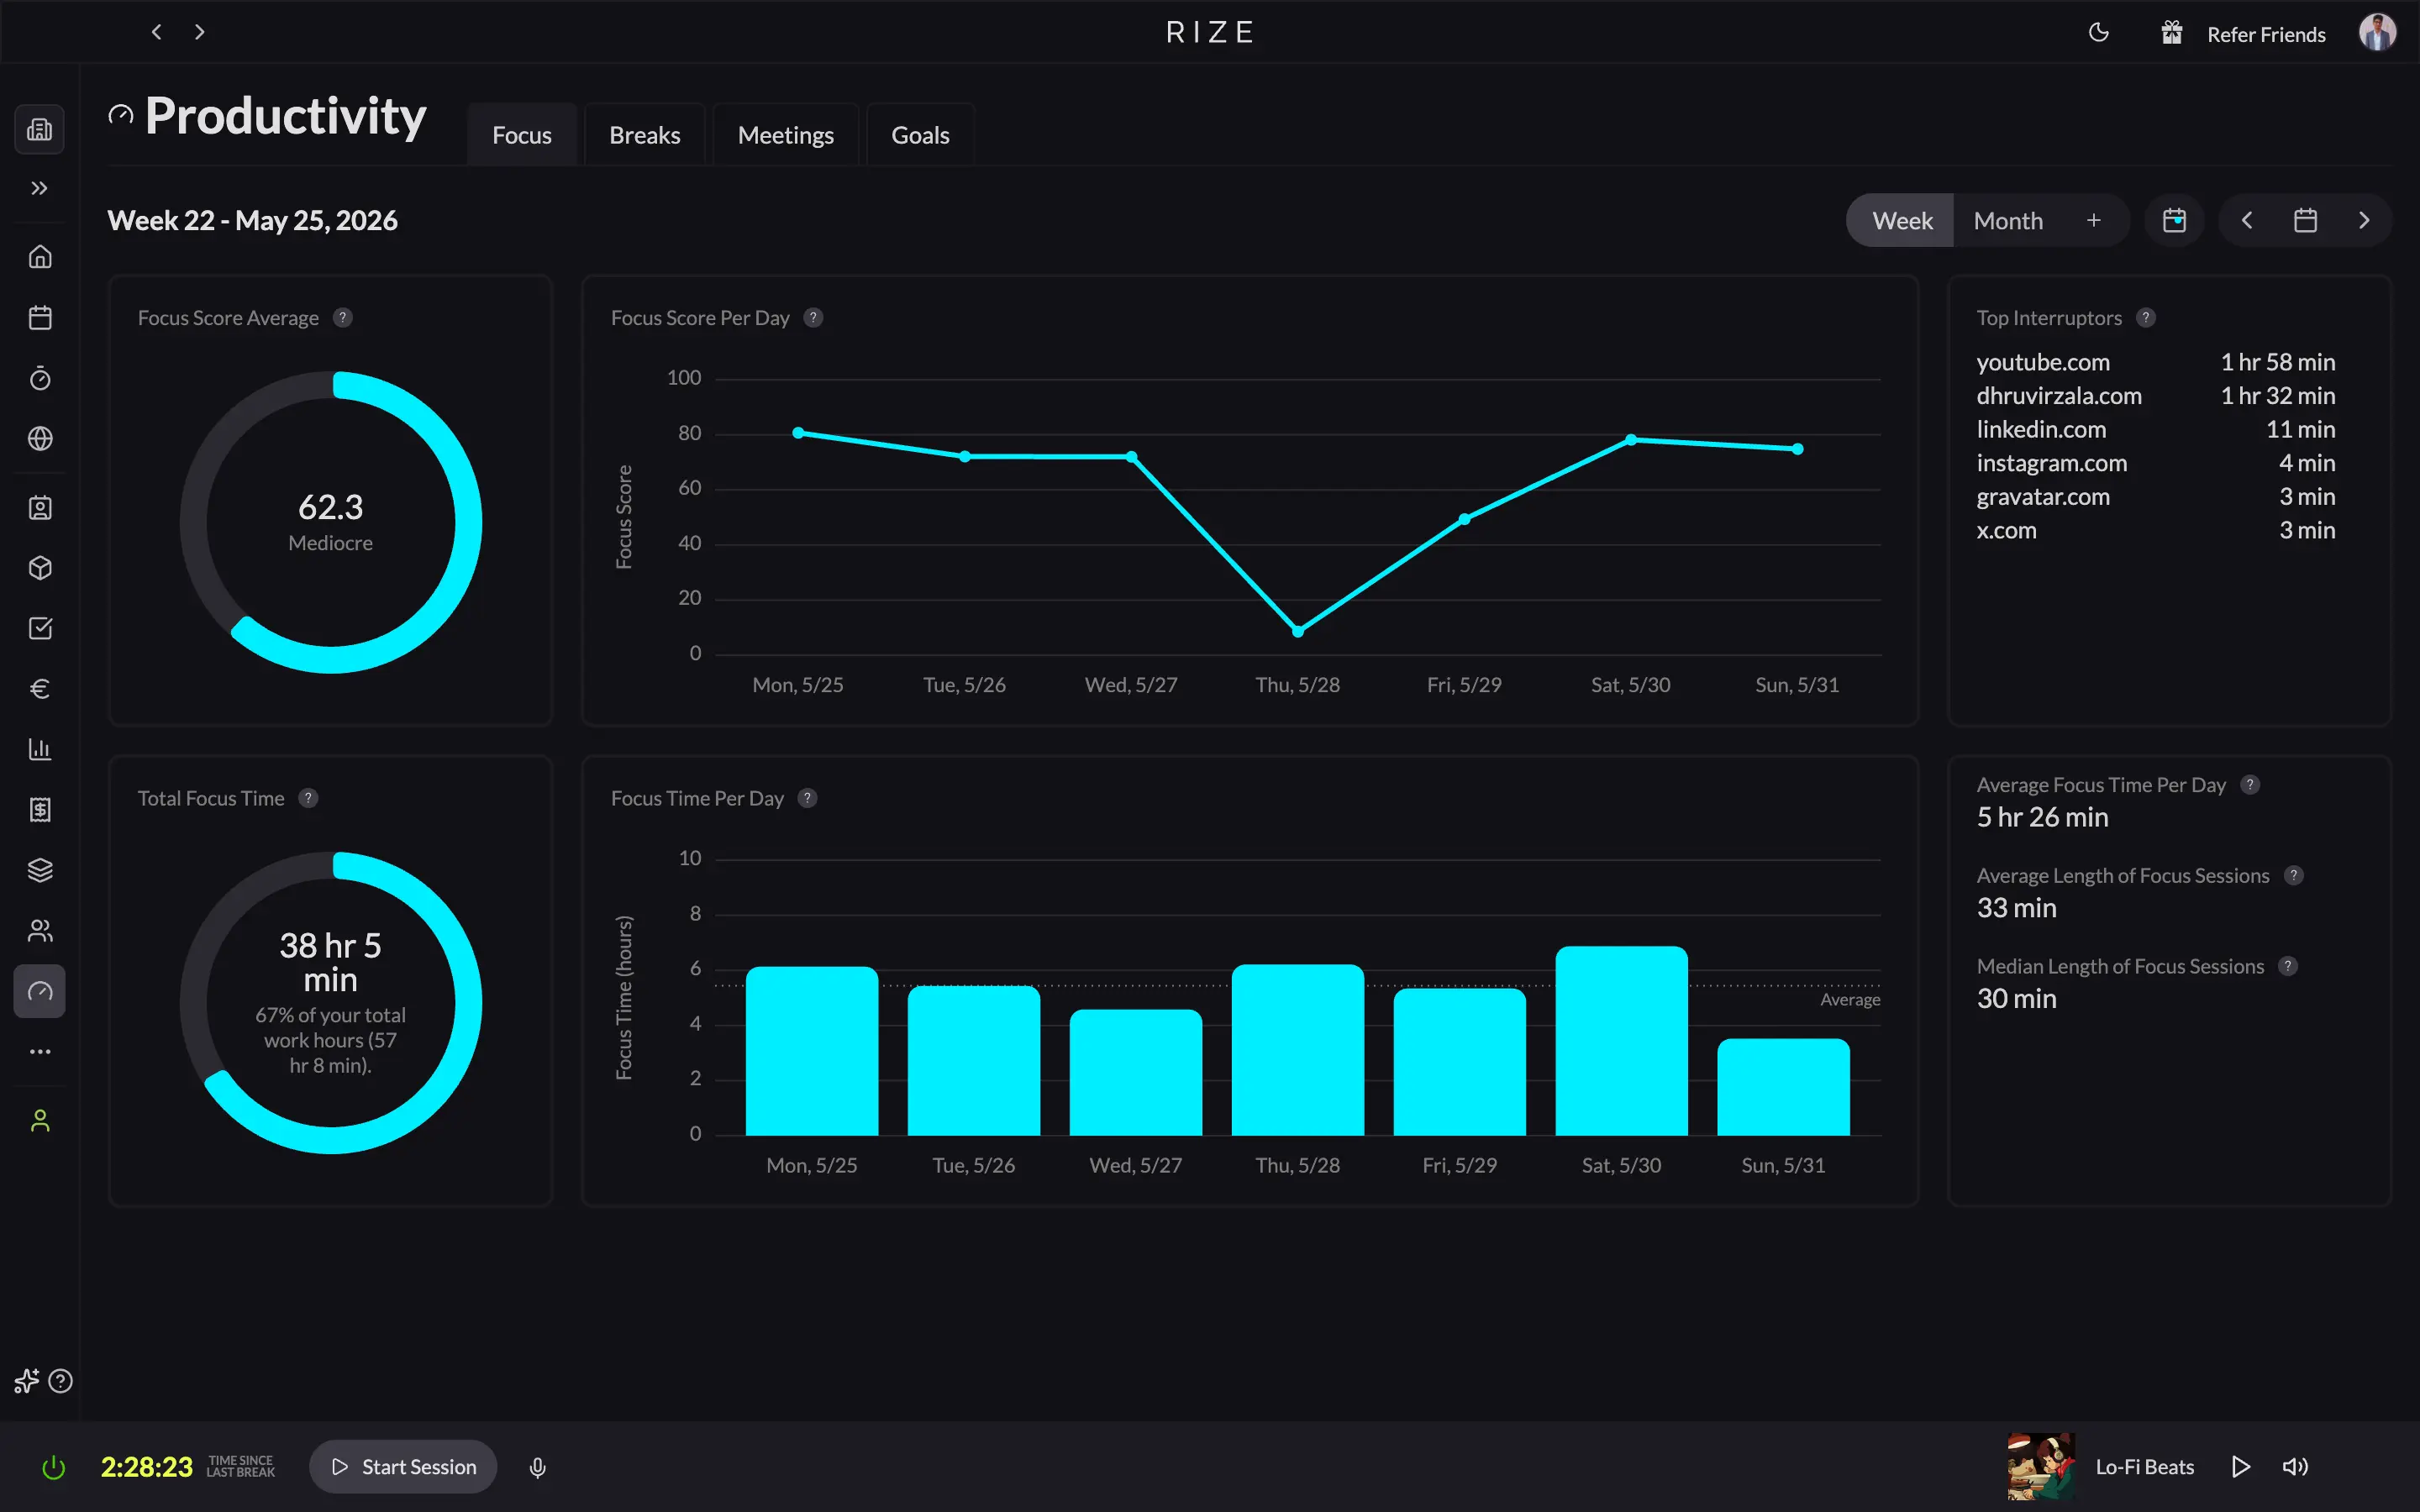
I went through 12 weeks of anonymized data from Rize. The dataset covers thousands of professionals, including agency teams, freelancers, and consultants who use it specifically to capture billable hours.
Here's what it actually shows about the client vs. internal split, and why the question itself needs a small rewrite.
Key takeaway: Agencies spend roughly 18% of every tracked week (about 7.2 hours per person) on coordination, not client deliverables. Messaging alone (7.8%) outweighs meetings (3.8%), and only 1 in 100 people tag client work at all. Most teams can't answer “client vs. internal” because nothing in their stack captures it.
The “internal tax”: six categories that have nothing to do with a deliverable
Across all 12 weeks, six categories consistently showed up as the cost of simply running a team, not doing the work itself:
| Category | Share of all tracked time | Avg hours/week per person | |---|---|---| | Messaging (Slack, Teams, WhatsApp, Discord) | 7.8% | 2.4 hrs | | Meetings & video calls (Zoom, Teams, Meet) | 3.8% | 1.7 hrs | | Email | 3.9% | 1.3 hrs | | Task management (Asana, ClickUp, Linear, Monday) | 1.4% | 0.8 hrs | | Admin | 0.9% | 0.7 hrs | | Calendar & scheduling | 0.6% | 0.3 hrs | | Total | ~18% | ~7.2 hrs |
Add it up, and you get roughly 18% of all tracked time across the platform going to coordination, not creation. Per person, that's close to a full workday gone every week before anyone opens a client deliverable.
This wasn't a one-week fluke either. Every number in that table held within about a point of itself across all 12 weeks. So this is not an anomaly.
That 18% is almost certainly a floor, not a ceiling. According to Asana's Anatomy of Work Index, knowledge workers spend 58% of their day on “work about work,” the status updates, approvals, and tool-hopping that surround the actual job. Our 18% only counts the time that lands in obvious coordination apps. The rest hides inside design tools and browsers, which is exactly why automatic categorization matters: automatic time tracking labels every session by app and URL instead of waiting for someone to log it.
The bigger surprise is which category leads. It's not meetings. Messaging is more than double the size of meetings (7.8% vs. 3.8%). Agencies love to complain about “too many meetings,” but the data says chat is the bigger drain, and it's the one nobody schedules a recurring audit for. Meetings at least get scrutinized: a 2022 Harvard Business Review study found that workers with at least one meeting-free day per week reported 73% higher productivity, and most agencies have at least debated a no-meeting block. Almost nobody runs the same audit on Slack.
Where “client work” hides, or doesn't
Here's the part that should concern agency owners more than the 18%.
Only about 1 in 100 people in this dataset have a “Client Work” category set up at all. For the other 99%, client work isn't a separate bucket. It's mixed into design tools, code editors, docs, and browsing time, the same categories that together make up nearly a fifth of the entire week on their own, with nothing separating “billed to a client” from "everything else."
But for the small slice that does tag client time explicitly, “Client Work” averages 4.5 hours a week. That's bigger than meetings and email combined (3.0 hrs), and bigger than messaging and meetings combined (4.1 hrs). The moment a team starts tagging client time, it doesn't just show up, it becomes the single largest line item in their entire week.
The other 99% can't see this, not because the work isn't happening, but because nothing is capturing it as “client” in the first place.
There's also a “Customer Support” category that shows up far more broadly (about 29% of users, averaging 0.9 hrs/week). It looks more like an auto-assigned bucket from tools like Zendesk or Help Scout than a deliberate setup, but for service businesses, it's at least a partial signal of client-facing time that exists without anyone configuring a single project.
Why 18% doesn't feel like 18%
If 18% sounds like something you could just “manage around,” here's why it doesn't feel that way day to day.
The average person switches between 11.9 different apps a day, generating around 590 app-switch events. That works out to roughly one switch every 34 seconds of active tracked time. Each of those switches carries a recovery cost. Research by Gloria Mark at the University of California, Irvine found it takes an average of 23 minutes and 15 seconds to fully refocus after an interruption. Most agency switches are faster round-trips than that, but the point holds: the coordination tax isn't just the 7.2 hours in the table, it's the focus those interruptions quietly shave off the client work around them.
And the single most common switch, week after week, by a wide margin, is Slack to Chrome and back again. Chat to browser, browser to chat, over and over.
That's the real shape of the internal tax. It's not a tidy block you can see coming on the calendar. It's woven through the entire day, interrupting whatever someone was actually doing, including client work, every 30 to 40 seconds.
How to actually shrink the internal tax
Start by measuring it, then cut the biggest line item first. You can't manage coordination overhead you can't see, and for 99% of teams the number simply doesn't exist yet.
Make the 18% visible. Before you change any behavior, get an automatic baseline of where the week goes. Manual timesheets won't produce this, because nobody logs the 40-second Slack detour. A tracker that reads what's actually open on screen turns coordination from a vague complaint into a number you can watch week over week.
Cut messaging before meetings. The data is clear that chat, not calendar, is the bigger drain. Batch non-urgent threads, move status updates to async, and protect a daily focus block. Even modest reductions matter, because every interruption you remove also returns the refocus time it would have cost.
Tag client work once, then let it run. The gap between the 1% who see their client split and the 99% who don't is setup, not effort. Map your design tools, repos, and client URLs to a project once, and from then on every billable hour gets attributed automatically. That's the foundation for real project profitability and accurate billable reporting, and it's what lets a manager see team utilization without chasing timesheets. For a deeper look at the billable side of this split, see our breakdown of where agency billable hours actually go.
What this means if you run an agency
Stop asking “what's our client vs. internal split” until you've asked, “can our tools even answer that question.” For 99% of teams in this data, the honest answer is no. The split exists in reality. It just doesn't exist anywhere in the data.
Use ~18% (about 7 hours/week per person) as your coordination baseline. If your team's meetings, chat, email, task apps, admin, and scheduling combined sit well above that, you don't have a vague “too much internal work” problem; you have a specific one. Start with messaging. It's the biggest of the six, and the one teams notice least.
A real client vs. internal split has to happen automatically. Manual tagging basically doesn't happen at scale; the 1% number proves that. The teams that do get a clear client-time picture get it because their tracker assigns time to a client or project based on what's actually open on screen, with zero extra steps for the person doing the work. That's the only version of this that survives a real workweek.
The honest answer to “where does our time actually go” isn't a guess, and it's not buried in last month's timesheets either. It's already being generated every time someone opens Slack, joins a call, or starts a design file. The only question is whether anything is set up to catch it.
How Rize can help you see this split clearly
Rize is the tool this data came from, and it's the direct answer to the two problems this article kept circling back to: nobody is tagging client time, and the coordination overhead is invisible until it isn't.
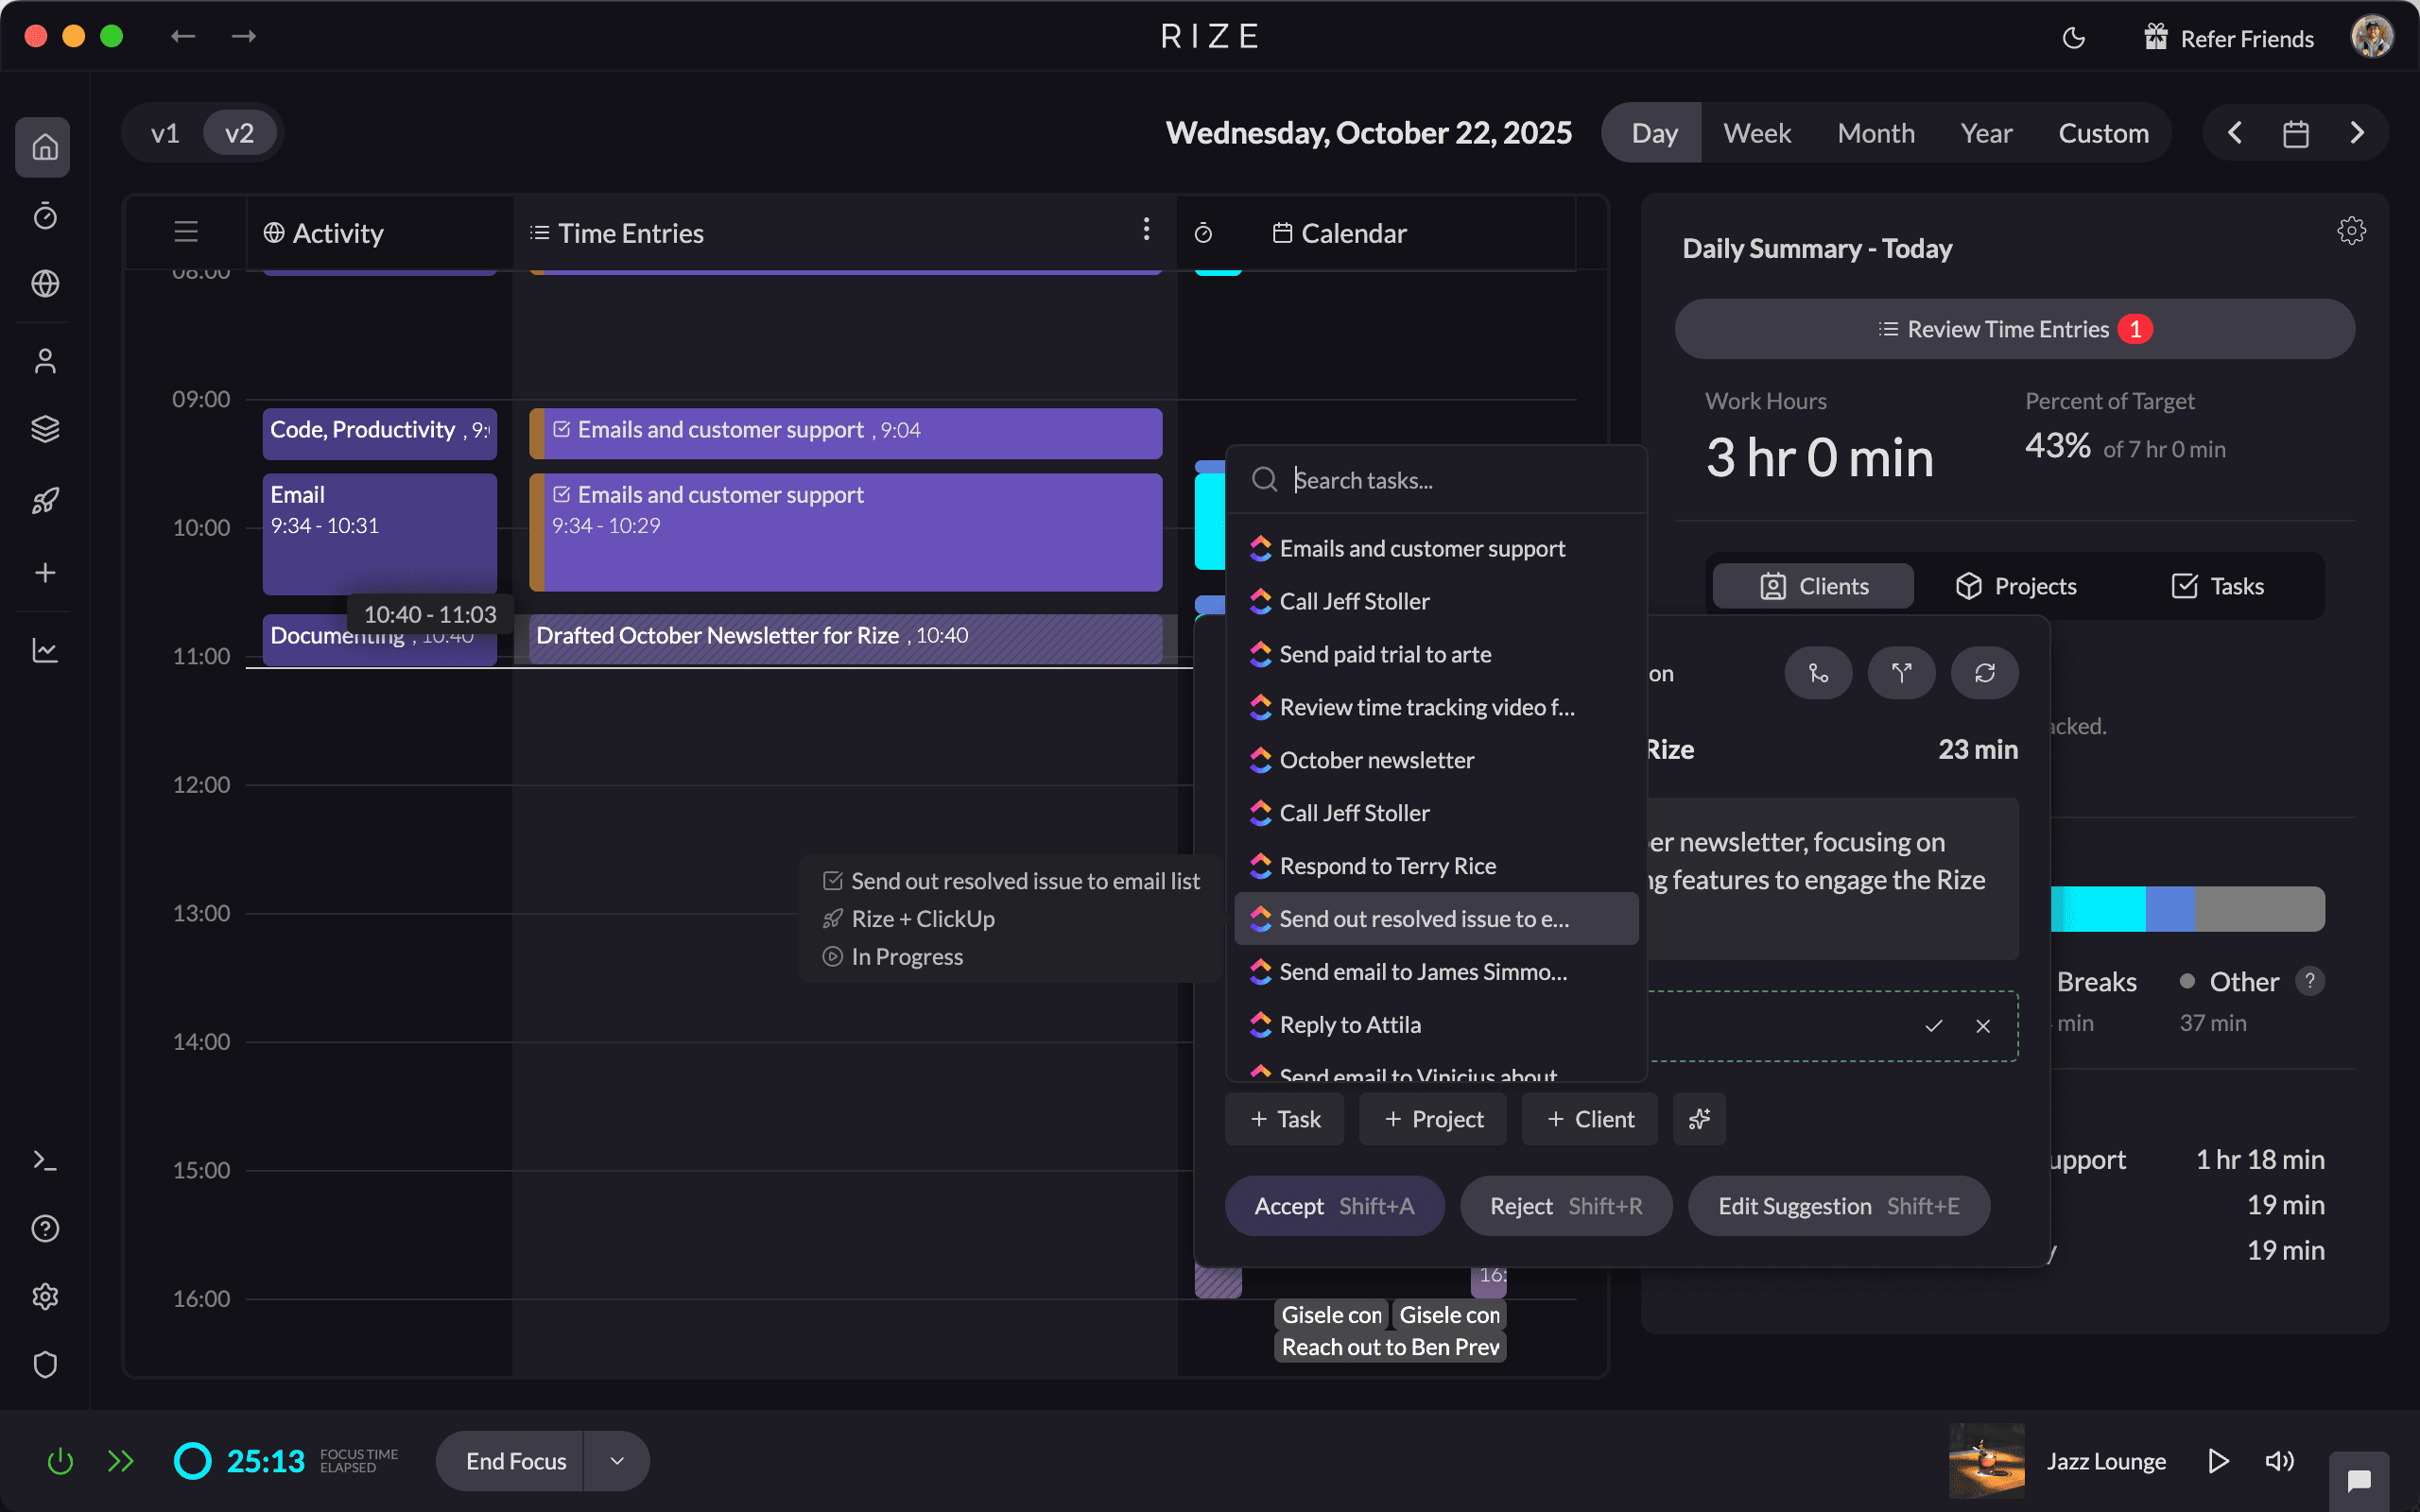
Here's what Rize does that most trackers don't. It runs quietly in the background on Mac and Windows and reads only window metadata, meaning the app name, window title, and URL. It watches what's open and for how long, then automatically categorizes that time into buckets like design, code, messaging, email, video calls, and task management. That's exactly how the coordination numbers in this article were calculated. Nobody had to log anything.
The part that closes the 1% gap is the client and project tracking layer. You tell Rize which apps, URLs, or window titles belong to which client or project, and from that point forward, every hour you spend in those tools gets tagged automatically. A designer working in Figma on a client's brand refresh doesn't have to do anything different. Rize sees the file name, matches it to the project rule you set once, and logs the time. When it's time to bill, or when you want to know whether that retainer is still profitable, the data is already there.
For agencies specifically, Rize also surfaces utilization and workload across the team in real time, so a manager can spot who's buried and who has capacity before it becomes a retention problem. And because no screenshots are ever taken, and team members review their own data before leadership sees it, the “is this surveillance?” conversation that kills adoption with most tracking tools never really comes up.
You can learn more and start a 7-day free trial (no credit card needed) at rize.io.
Start tracking time automatically
Join thousands of professionals who stopped guessing where their time goes. Free for 7 days.
“Rize has been a no-brainer for me.” — Ali Abdaal Read more →