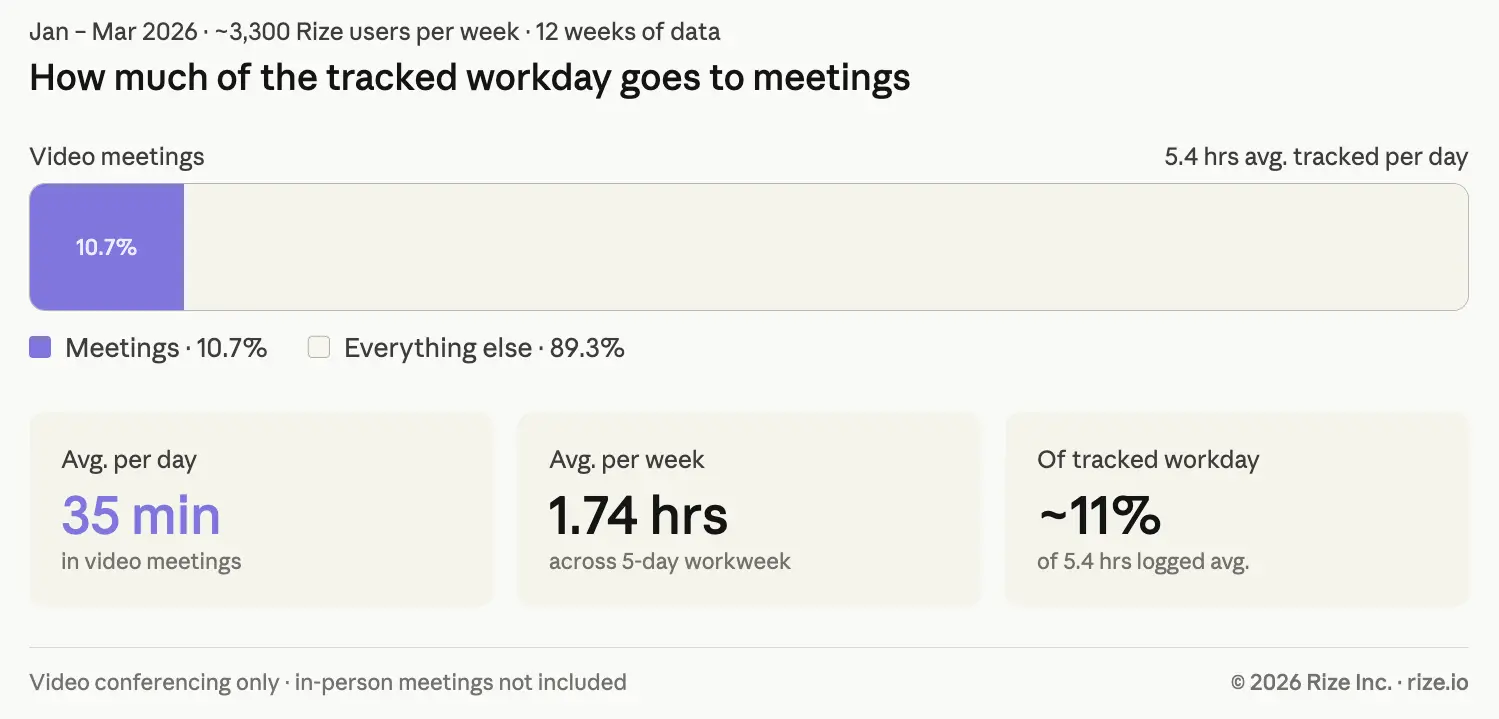
There are plenty of opinion pieces about meetings. This is not one of them. What follows is 12 weeks of real, anonymous time tracking data from Rize users, covering January through late March 2026. The dataset spans roughly 3,300 to 3,500 professionals per week, many of them agency owners, creatives, consultants, and knowledge workers who use Rize as their primary time tracker. The headline: the average user spent 35 minutes per day in video meetings, or about 1.74 hours per week, roughly 11% of the tracked workday.
Quick Answer
How much time agencies spend in meetings: Real Rize data shows 35 minutes per day in video meetings, 1.74 hours per week, about 11% of the tracked workday. Microsoft Teams users run the longest sessions at 2.01 hours per week, roughly 87% more than the Zoom desktop app. Start a free 7-day trial to benchmark your own team.
| Metric | Finding |
|---|---|
| Average daily meeting time | 35 minutes |
| Average weekly meeting time | 1.74 hours |
| Meetings as % of tracked workday | ~11% |
| Lightest week | Feb 1: 1.54h/week |
| Heaviest week | Mar 29: 1.99h/week |
| Tool with the longest sessions | Microsoft Teams (2.01h/user/week) |
| Data period | Jan 4 to Mar 29, 2026 |
| Sample size | ~3,300 to 3,500 users per week |
How much time do agencies spend in meetings per day?
The average Rize user spent 35 minutes per day in video meetings, which works out to 1.74 hours per week across all 12 weeks analyzed. Against an average tracked workday of 5.4 hours, meetings eat up roughly 10.7% of total tracked time.
That is not as much as the "meetings have swallowed our lives" narrative suggests, but it is not trivial either, especially once you account for the recovery cost around each call. Research by Gloria Mark at the University of California, Irvine found it takes an average of 23 minutes and 15 seconds to fully refocus after an interruption. A 30-minute meeting rarely costs 30 minutes. It costs the meeting plus the ramp back into focused work on either side.
Is agency meeting time increasing or decreasing?
Meeting load increased from January through March, not the other way around. The January average was 1.70 hours per week, February dropped to 1.63 hours, and March climbed to 1.85 hours.
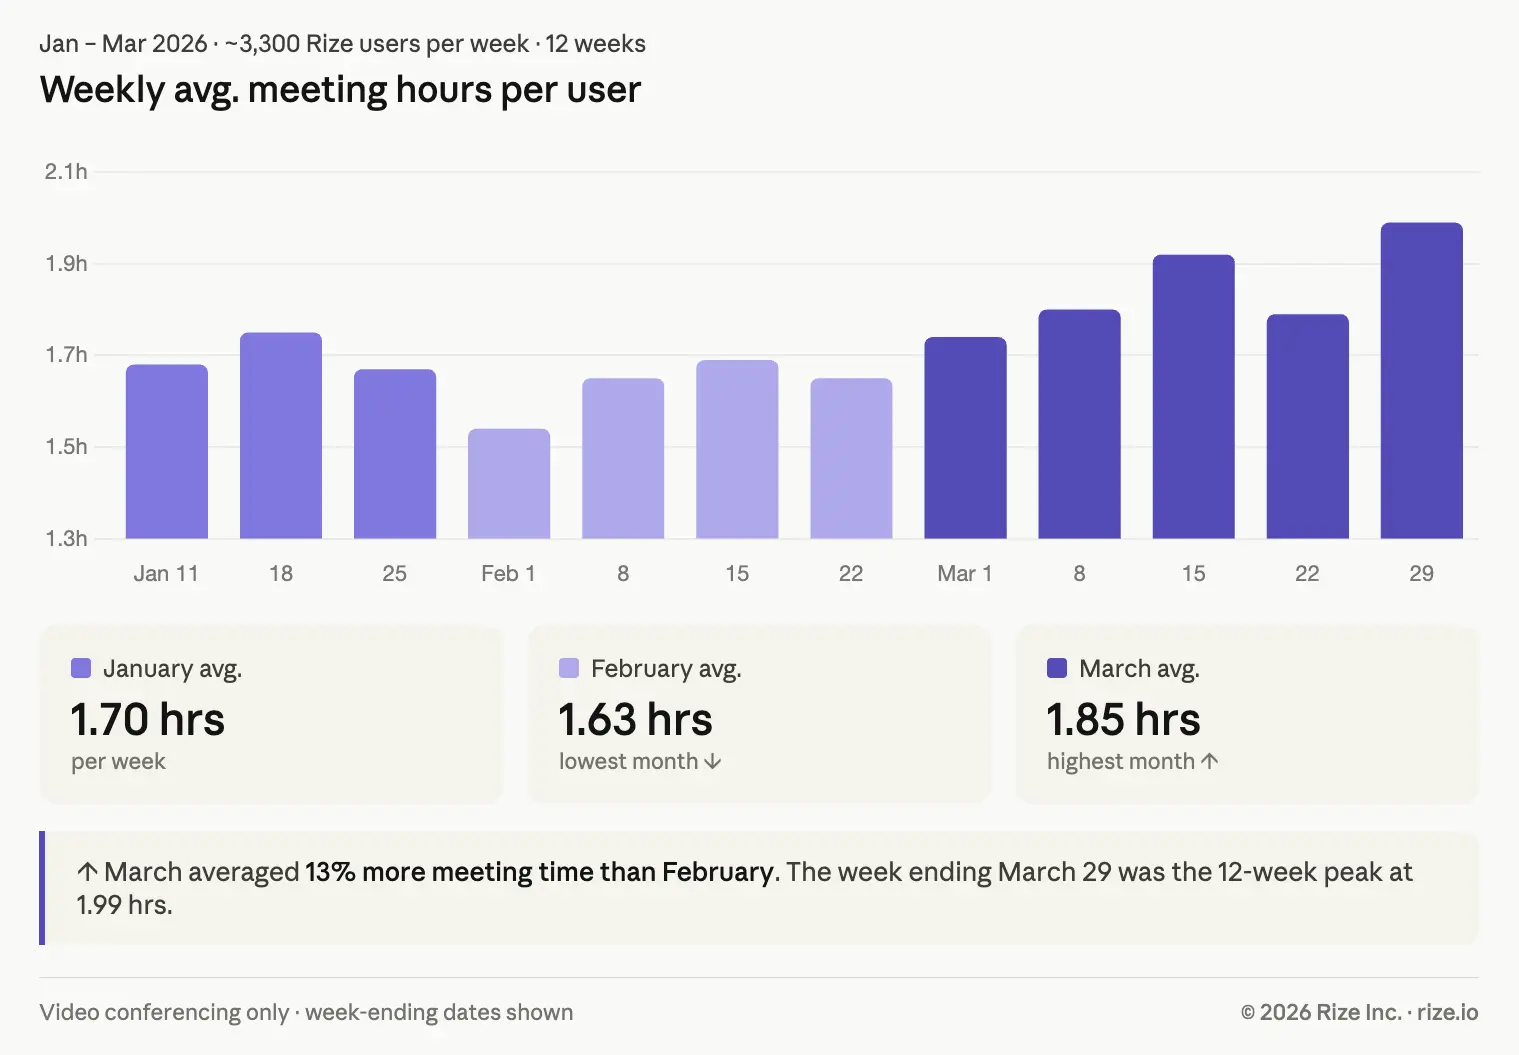
February was the lightest month in the dataset. The week ending February 1 was the lowest of the entire window at just 1.54 hours per user, which could reflect shifting end-of-month planning cadences or simply less business activity early in the month. March ran hot. By the week ending March 29, the average hit 1.99 hours per week, the highest point in the data. That is nearly two full hours per person, per week, in video calls alone. For a five-person agency, that is almost a full workday of collective meeting time every week.
If your agency runs quarterly planning or review cycles, expect meeting hours to climb heading into quarter-end. The trend direction matters more than any single week.
See how much time your team spends in meetings
Rize tracks every meeting automatically: Zoom, Google Meet, Teams, and ad-hoc calls. No timers needed.
Start Free TrialWhich video meeting tool has the longest sessions?
Microsoft Teams users logged the highest average session time of any tool at 2.01 hours per user per week across the full 12 weeks, roughly 87% more than the Zoom Meetings desktop app at 1.06 hours. Teams also appeared as one of the top two meeting sources every single week without exception.
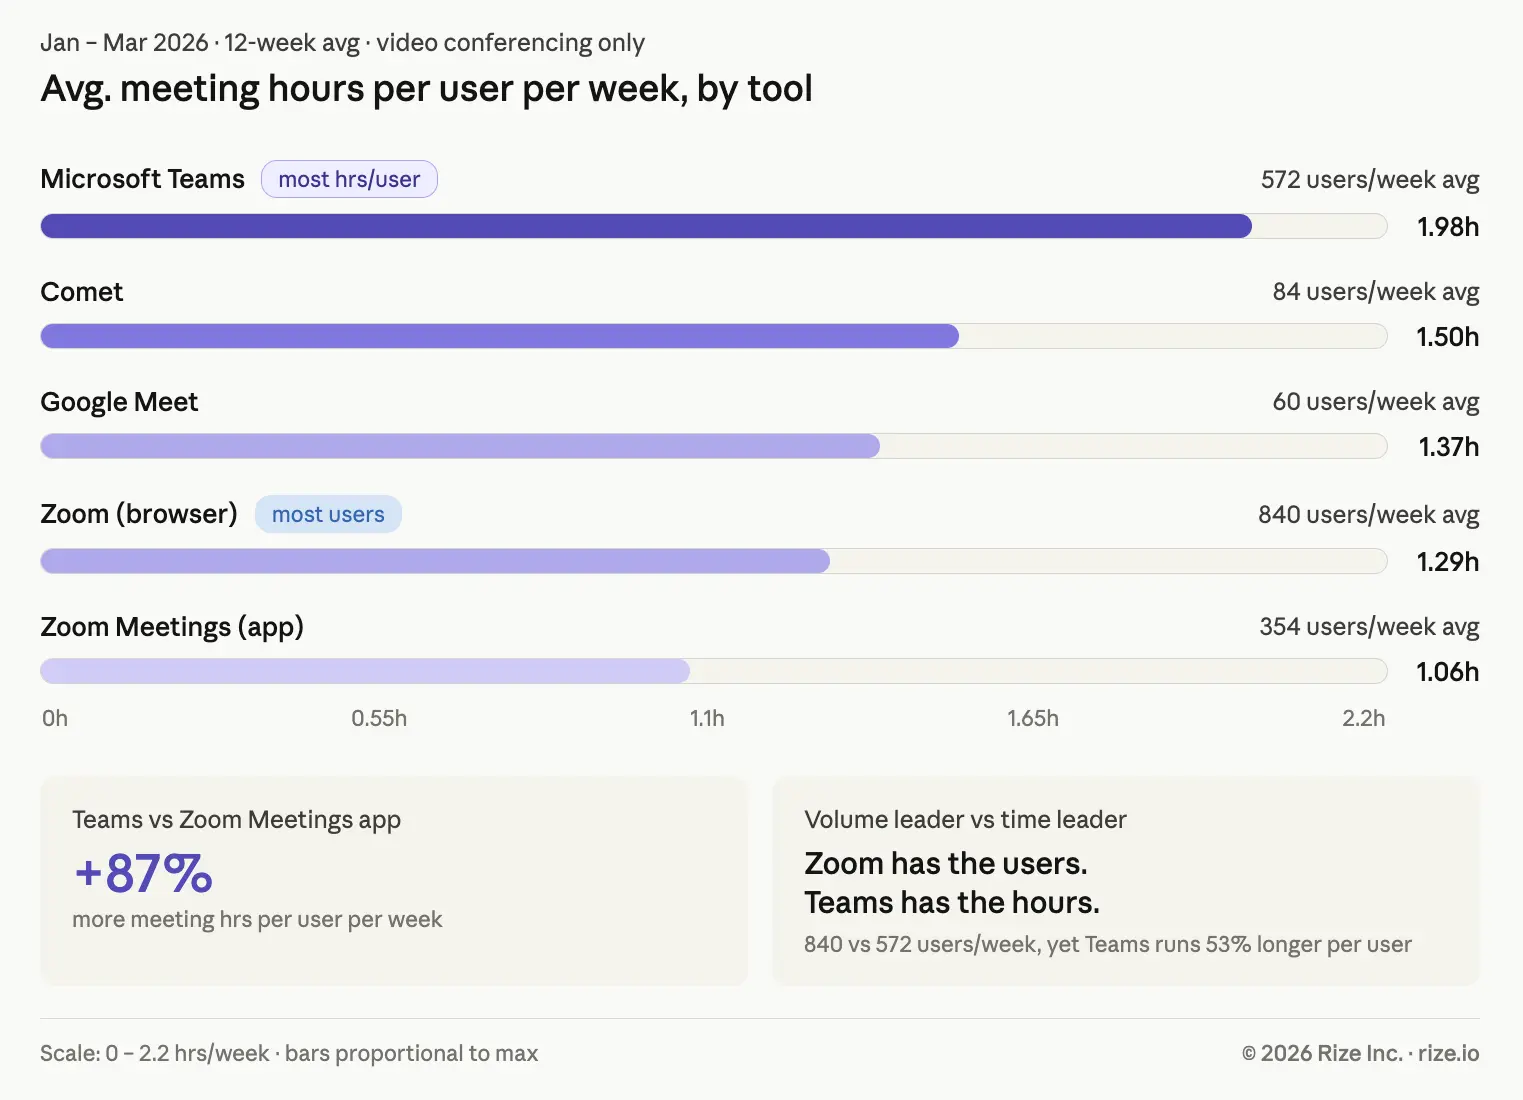
Zoom is split across two entries in the data: the browser-based version and the desktop app. Combined, Zoom users averaged around 1.15 to 1.32 hours per user per week depending on the client, with desktop users at the low end near 1.06 hours. Google Meet users averaged about 1.16 to 1.68 hours depending on the week, landing in the middle of the pack. Comet, a newer video tool with a smaller but consistent user base, averaged 1.49 hours per user per week, higher than most Zoom configurations.
The takeaway: the tool you meet on appears correlated with how long you spend in meetings. Teams users are consistently in the longest sessions. Whether that is because Teams skews toward larger organizations with longer meeting cultures, or because the interface makes it easier to run long, is hard to say from this data alone. But the pattern is real. It is worth auditing whether your meeting length norms are set by the tool's defaults or by intentional time-boxing.
Do meetings take more time than messaging at work?
No. Messaging and email each consumed more tracked time than video meetings. In the full category breakdown, video conferencing ranked near the bottom of the top categories at roughly 3.6% of total tracked time, behind entertainment, browsing, coding, messaging, documenting, productivity, design, and email.
The point is not that meetings are small. It is that messaging, meaning Slack, Teams chat, iMessage, and similar tools, takes up more tracked time than meetings do, and so does email. If you are hunting for where non-billable communication time goes at your agency, meetings are one part of the answer, not the whole picture. The same fragmentation shows up in our analysis of the hidden cost of context switching, where messaging apps were the single biggest trigger of lost focus.
What the data does not capture
This data captures video conferencing time detected by the Rize desktop app through window titles and app metadata. It does not capture in-person meetings, phone calls, informal standups, or the prep and recovery time around each meeting.
In-person meetings did appear in custom category data, with a small but nonzero share of users tracking time in an "in person meetings" category, which suggests some people log those separately. But that category represents a small fraction of the total. The practical implication: 1.74 hours per week is likely an undercount of total meeting load. Add prep, context-switching recovery, and any in-person or phone-based meetings, and the real number is higher for most agency professionals. This pattern is consistent with long-running findings from Harvard Business Review's "Stop the Meeting Madness", which documented how meeting time tends to expand and spill past its scheduled boundaries.
How to act on these meeting benchmarks
Use the numbers as a baseline, then audit against them. If your team is well above 1.74 hours per week per person, or your Teams sessions routinely run past two hours, you have a measurable target to cut against rather than a vague sense that there are "too many meetings."
Start with the most expensive recurring meetings, ranked by attendees times duration times frequency, and apply a kill, shrink, or async test to each. The fastest way to know where you stand is to measure it: Rize captures every meeting automatically, alongside the focused work it interrupts, so you can see the full picture without asking anyone to fill out a timesheet.
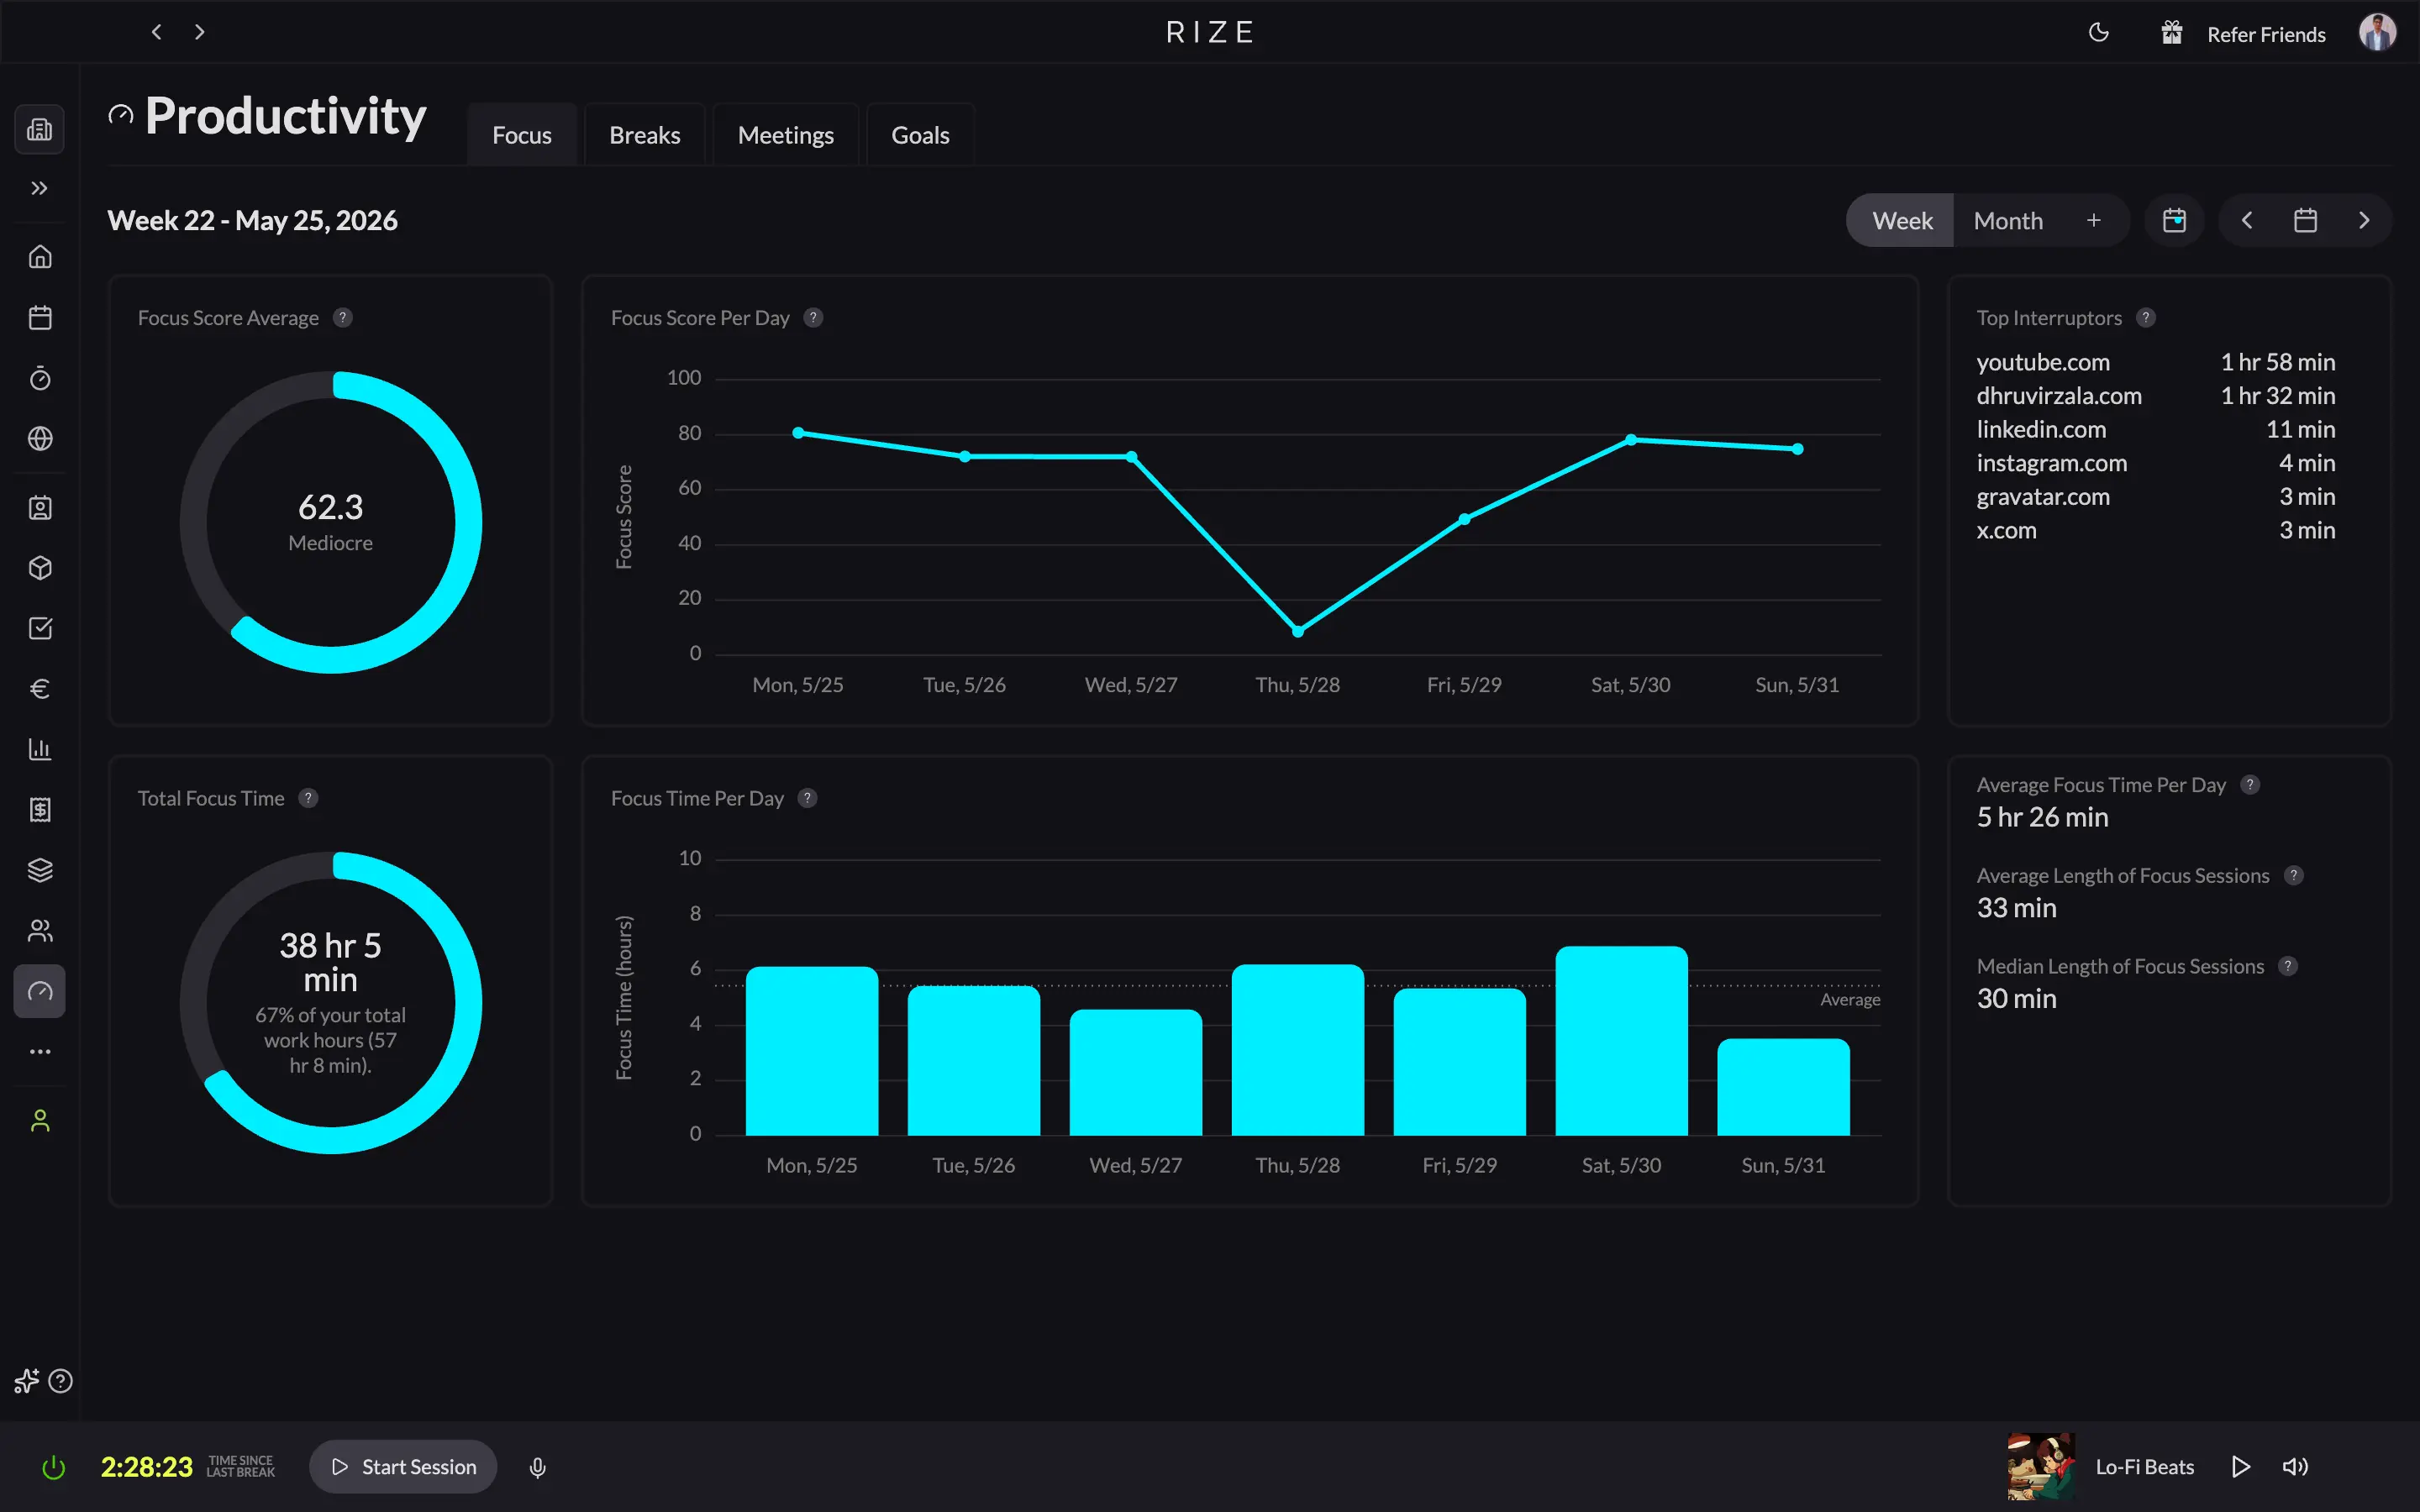
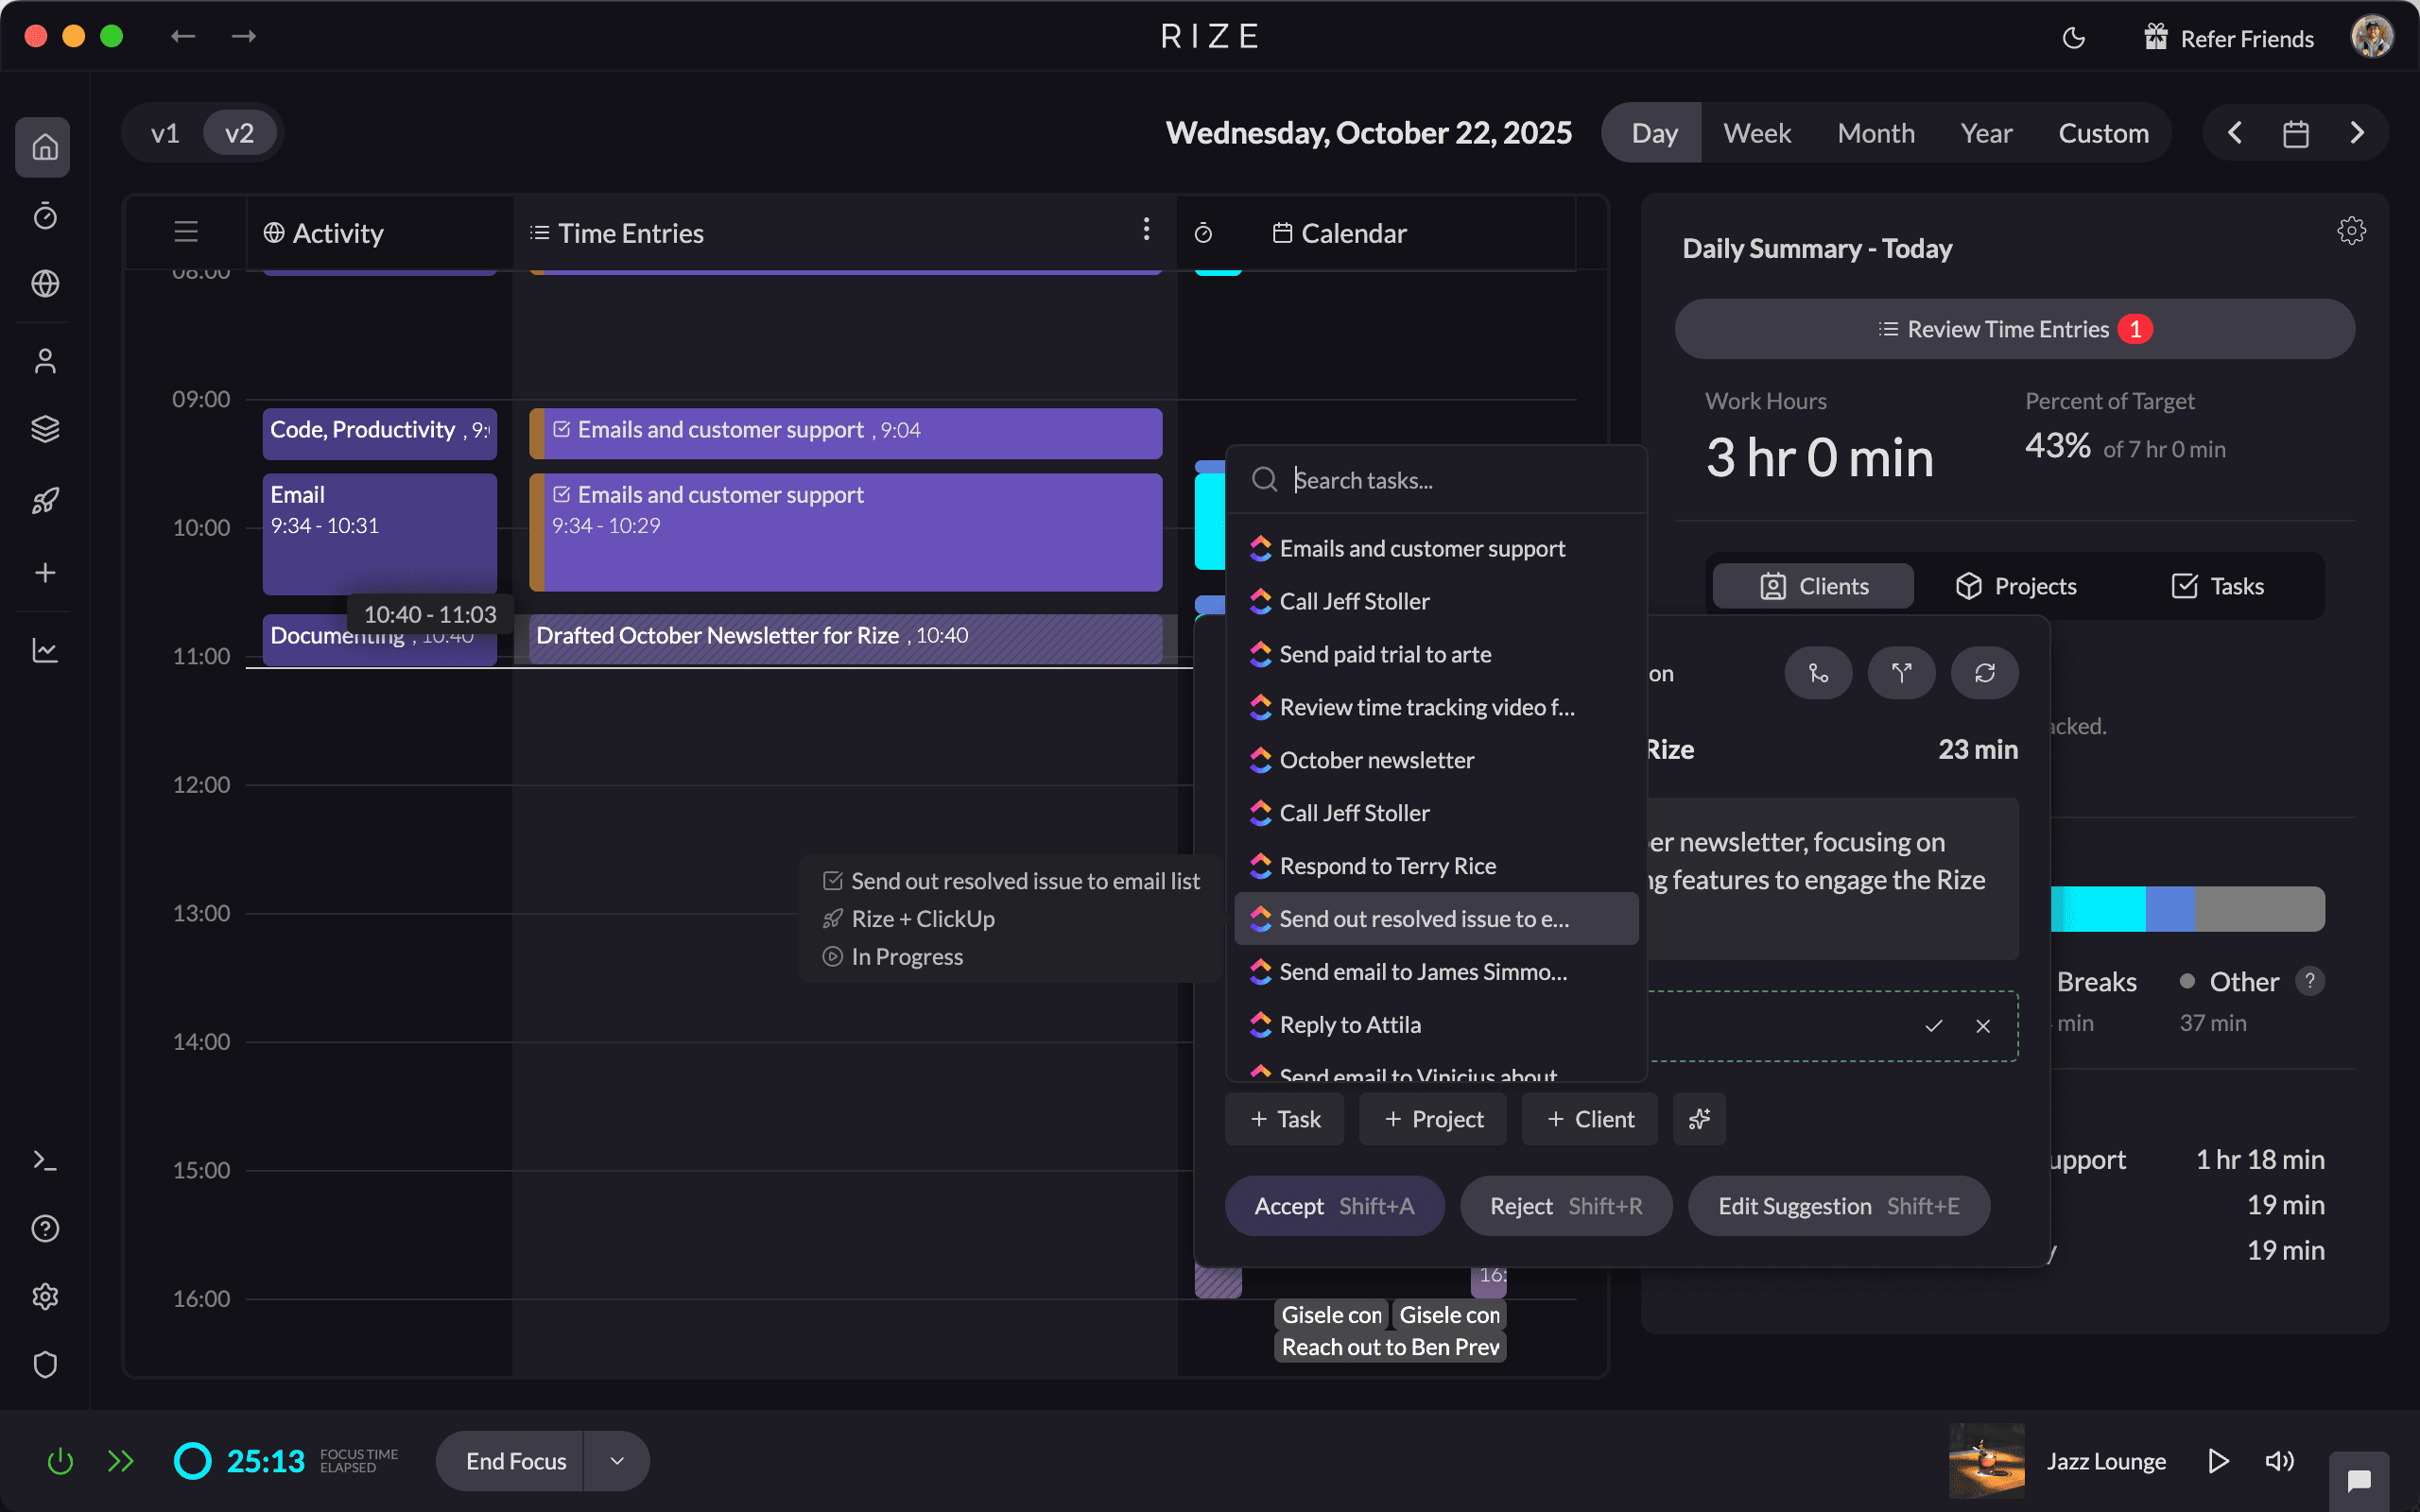
Rize runs silently in the background on Mac and Windows. No timers, no manual entries, no screenshots. It reads window titles and app metadata to categorize time automatically, including detecting when a meeting is in progress. Every minute in this dataset came from that passive detection. For agency leaders, the same automatic time tracking rolls up across a whole team, so meeting overload shows up before it drains billable capacity.
See how your agency's meeting time compares. Rize tracks it automatically. Start a free 7-day trial.
Data source: anonymous, aggregated Rize user data, 12 weeks from January 4 through March 29, 2026. Sample size approximately 3,300 to 3,500 unique users per week. All figures represent video conferencing time as detected by the Rize desktop application.
Start tracking time automatically
Join thousands of professionals who stopped guessing where their time goes. Free for 7 days.
“Rize has been a no-brainer for me.” — Ali Abdaal Read more →