Most "most used apps" lists come from surveys. Surveys measure what people say they use, not what they actually use. Ask someone which tools they rely on and they will name the polished stack, not the messy reality of their day.
This list is different. It comes from passive, automatic time tracking. Rize records which apps people actually spend time in, at the OS level, without anyone reporting anything.
We filtered to agency-plan workspaces only -- teams of 5 to 116 people on Rize's agency and team tiers. The result is 65 active agency users across 30 days of tracked time, totaling 4,834 hours. What follows is the real picture of how agency work happens, ranked by actual hours tracked.
Sidenote. All figures are drawn from anonymized, aggregated Rize data from agency-plan workspaces. No individual user or organization is identifiable. Hours are total tracked foreground time unless otherwise noted.
Before the list, two numbers set the scene. Agency workers tracked 74.4 hours per user over 30 days and spent 24% of that time on coordination -- messaging, email, task management, and admin. Solo professionals tracked 69.8 hours and spent just 12% on coordination. Agencies pay a coordination tax that solo workers mostly avoid.
Where agency time goes
| Category | Agency % | Solo % | Takeaway | |---|---|---|---| | Code | 13.1% | 19.1% | Solo users code more; agencies spread wider | | Productivity | 12.0% | 6.8% | Agencies spend nearly 2x on productivity tools | | Video conferencing | 9.1% | 11.4% | Roughly equal -- meetings are universal | | Messaging | 8.9% | 5.9% | Agencies message 1.5x more | | Email | 7.0% | 3.1% | Agencies email 2.3x more (client communication) | | Design | 4.6% | 2.2% | Agencies design 2x more | | Documenting | 4.5% | 6.8% | Solo users document more per person | | Task management | 3.8% | 1.2% | Agencies: 3x more PM tooling | | Admin | 4.1% | 1.7% | Timesheets, invoicing, HR -- the invisible layer |
The coordination tax is real. Messaging + email + task management + admin = 24% of agency time versus 12% for solo. That gap does not show up on a P&L. It shows up in the difference between hours tracked and hours billed.
Communication and messaging
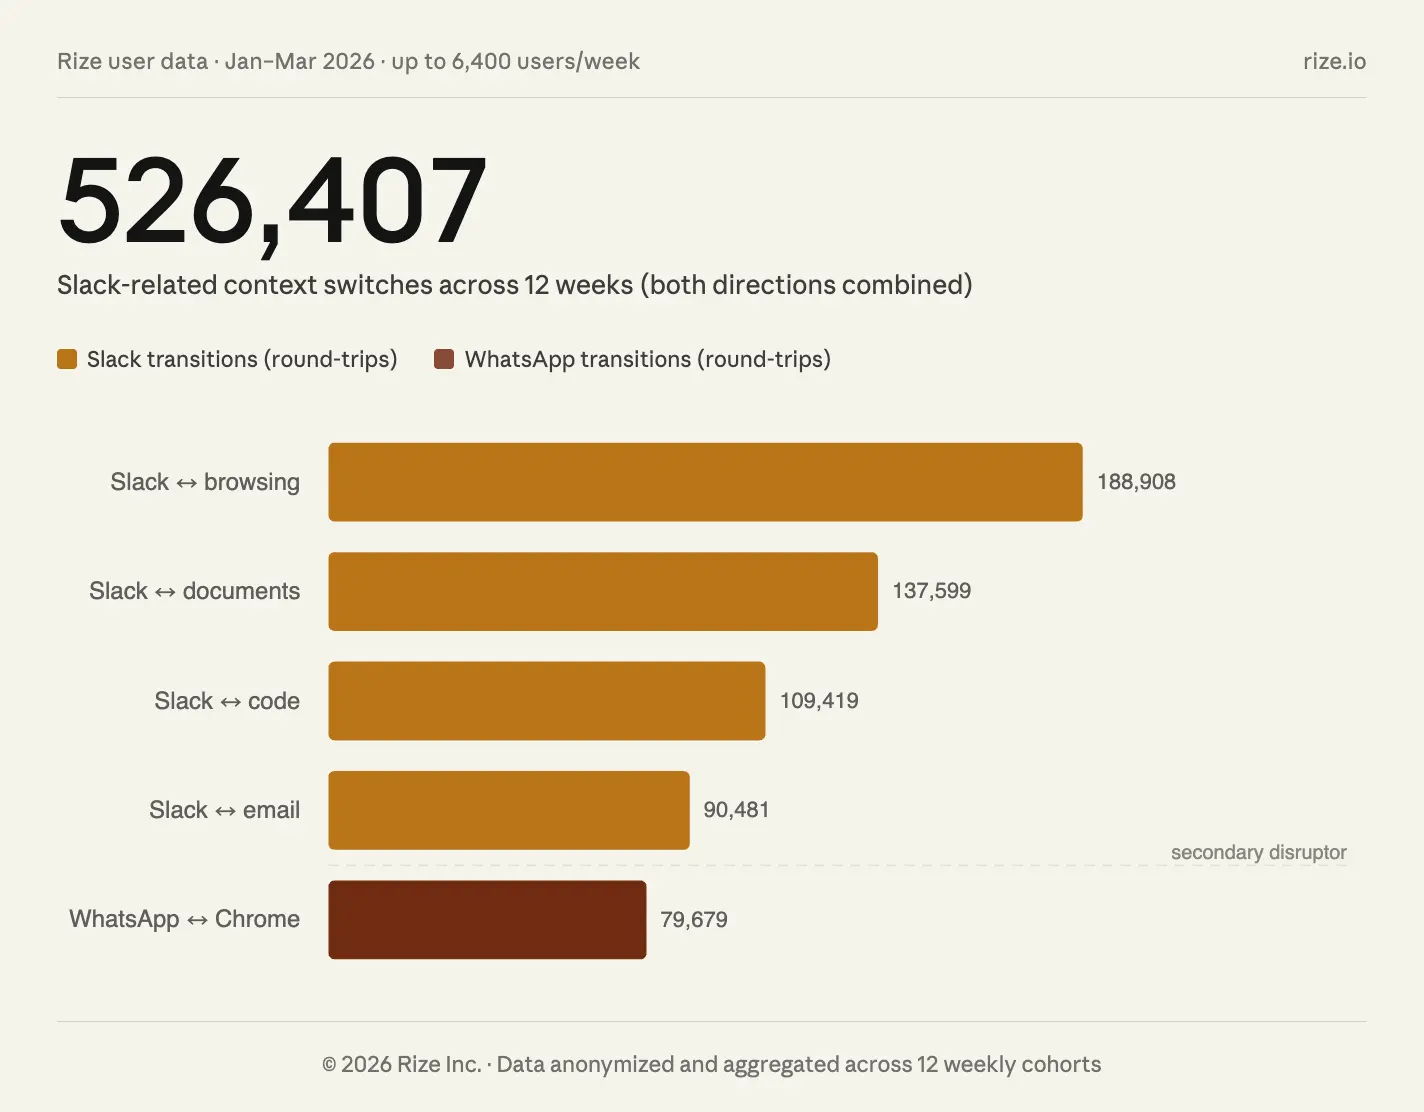
Communication is the largest non-code time sink for agencies. Slack alone logged more hours than any other single tool.
| Rank | App | Hours | Users | Note | |---|---|---|---|---| | 1 | Slack | 327h | 38 | The agency nervous system. Top context-switch pair: Slack to Chrome. | | 4 | Microsoft Teams | 175h | 18 | Coexists with Slack, rarely replaces it | | 27 | Messages (Apple) | 49h | 14 | Quick client pings | | 40 | WhatsApp | 23h | 12 | Client comms in international markets | | 49 | Discord | 17h | 9 | Community channels, some client work |
Agency teams spend 8.9% of tracked time in messaging apps -- 1.5x more than solo professionals. The Slack-to-Chrome context switch is the most frequent transition in the dataset.
See which apps your team actually uses
Rize tracks app usage per person automatically -- no surveys, no screenshots. Free for 7 days.
Start Free TrialAI tools
AI adoption in agencies is no longer speculative. Claude appeared in 68% of agency workspaces. Combined, AI tools (Claude + Cursor + Codex + ChatGPT) logged more hours than email or video conferencing.
| Rank | App | Hours | Users | Hrs/user | Note | |---|---|---|---|---|---| | 2 | Claude (desktop) | 267h | 44 | 6.1 | Most adopted AI tool -- 68% of workspaces | | 3 | Kiro | 198h | 6 | 33.0 | Amazon's AI IDE -- tiny base, extreme depth | | 9 | Cursor | 130h | 10 | 13.0 | Heaviest per-user engagement among dev tools | | 14 | Claude.ai (web) | 83h | 40 | 2.1 | Desktop app getting more hours than web | | 19 | Codex | 60h | 12 | 5.0 | Already bigger than many established tools | | 22 | ChatGPT (web) | 54h | 33 | 1.6 | Broad reach, lighter sessions | | 46 | ChatGPT (desktop) | 19h | 7 | 2.8 | Desktop app growing |
Claude combined (desktop + web) = 350 hours across the agency base. ChatGPT combined = 73 hours. Claude leads by nearly 5x in agency usage.
Cursor stands out for engagement: 10 users averaging 13 hours each. The people who use AI coding tools live in them.
| Rank | App | Hours | Users | Note | |---|---|---|---|---| | 5 | Microsoft Outlook | 164h | 20 | The client email hub | | 6 | Gmail (web) | 159h | 49 | Most-reached email client, lighter per-user |
Email consumes 7% of agency time -- 2.3x more than solo professionals. The split is clear: Outlook for heavy client correspondence, Gmail for everything else. Gmail reaches 75% of agency users but Outlook users spend 3x more time per person.
Video conferencing
| Rank | App | Hours | Users | Note | |---|---|---|---|---| | 8 | Google Meet | 136h | 35 | Primary video tool for agencies | | 13 | Zoom Meetings | 86h | 16 | Secondary, heavier per-user | | 34 | zoom.us (launcher) | 31h | 18 | Browser launcher entry | | 44 | Zoom (web) | 20h | 12 | Web client |
Google Meet leads Zoom by hours and users in agency teams. Combined Zoom (all entries) = 137 hours, roughly even with Meet. Video conferencing = 9.1% of agency time -- almost identical to solo professionals (11.4%). Meetings are universal; the coordination tax comes from messaging and email, not meetings.
Productivity and documentation
| Rank | App | Hours | Users | Note | |---|---|---|---|---| | 7 | Google Docs | 154h | 51 | The shared workspace -- widest reach of any web app | | 16 | Microsoft Word | 79h | 24 | Client deliverables | | 18 | Microsoft Excel | 62h | 28 | Still the universal spreadsheet | | 43 | Google Drive | 20h | 46 | File hub, high reach | | 47 | Notion | 19h | 25 | The agency wiki |
Google Docs has the widest reach of any web app: 51 of 65 agency users. But agencies actually spend less time documenting per person than solo users (4.5% vs 6.8%). The difference is productivity tooling: agencies spend 12% on productivity versus 6.8% for solo -- nearly 2x.
Project management
| Rank | App | Hours | Users | Note | |---|---|---|---|---| | 12 | ClickUp (web) | 100h | 20 | The agency PM tool of choice | | 36 | ClickUp (desktop) | 29h | 9 | Combined ClickUp: 129 hours |
ClickUp dominates project management in the agency dataset. Combined (web + desktop) = 129 hours, making it the 7th largest time sink overall. SmartSuite appeared at 53 hours with 10 users -- a growing alternative.
Notably, Asana and Monday.com did not appear in the top 50 -- a striking absence for tools with such strong brand presence in the agency world.
Design and creative
| Rank | App | Hours | Users | Note | |---|---|---|---|---| | 23 | Adobe Photoshop | 53h | 2 | Deep usage: 26 hrs/user | | 37 | Adobe Illustrator | 26h | 2 | Vector work, same power users | | 41 | Canva (web) | 22h | 11 | 5x more users than Adobe, 2x less time per user |
Design = 4.6% of agency time, double the solo rate (2.2%). The split is instructive: two Adobe power users logging deep sessions, versus 11 Canva users dipping in for quick assets. Figma did not break the agency top 50 in this 30-day window, though it leads in the broader all-user dataset.
Developer and terminal tools
| Rank | App | Hours | Users | Note | |---|---|---|---|---| | 9 | Cursor | 130h | 10 | AI-native IDE, heaviest per-user | | 20 | Windows Terminal | 59h | 6 | Power users | | 21 | Firefox | 57h | 5 | Dev browser of choice for some | | 32 | VS Code | 33h | 2 | Classic, but Cursor is taking share | | 33 | GitHub (web) | 31h | 25 | Code review, issues, PRs |
Code is the single largest category at 13.1% of agency time. But solo professionals code even more (19.1%). The delta is not less engineering -- it is more of everything else pulling agency developers away from focused work.
Browsers and system tools
| Rank | App | Hours | Users | Note | |---|---|---|---|---| | 10 | Google Chrome | 108h | 55 | Container for web apps -- 85% reach | | 17 | Windows Explorer | 63h | 29 | File management | | 26 | Dia | 50h | 1 | AI-native browser, single power user | | 50 | Microsoft Edge | 16h | 19 | Broad but light |
Chrome appears in 55 of 65 agency users (85% reach) but ranks only 10th by hours. Most of what agencies do in Chrome shows up under its own domain: Gmail, Google Docs, Meet, ClickUp. The browser is the container; the work lives in web apps.
Other notable tools
| Rank | App | Hours | Users | Note | |---|---|---|---|---| | 11 | Rize | 106h | 64 | Near-universal (98% reach), minimal time spent | | 28 | LinkedIn (web) | 37h | 40 | Prospecting and networking | | 29 | HubSpot | 37h | 5 | CRM for client-facing teams | | 30 | Google Calendar | 35h | 38 | Scheduling layer | | 31 | Spotify | 34h | 10 | Foreground only -- background time uncounted | | 35 | Google Search | 30h | 51 | Widest reach of any single domain | | 38 | Secureframe | 26h | 9 | Compliance tooling -- SOC2 prep | | 45 | YouTube | 19h | 40 | Research, tutorials, client work |
Rize itself appears in 98% of agency users at just 1.7 hours per user over 30 days -- exactly what you want from a tracker: universal presence, minimal attention required.
Map your agency's real tool stack
Book a 15-minute walkthrough. See which apps each person uses, how long, and where the hours actually go.
Book a DemoFinal thoughts
Three patterns stand out from the data.
First, the coordination tax is real and measurable. Agencies spend 24% of their time on messaging, email, task management, and admin -- double what solo professionals spend. This is the structural cost of running a team, and it does not appear on any invoice.
AI tools have arrived in agency workflows. Claude appeared in 68% of agency workspaces. Combined AI tool usage (Claude, Cursor, Codex, ChatGPT) exceeded both email and video conferencing. This is not a tech-forward outlier -- this is the agency mainstream.
The gap between hours tracked and hours billed is where money leaks. Design, code, and client meetings are billable. The 24% spent on coordination is not. Automatic time tracking captures both, so you can see the real ratio and start closing the gap.
Start tracking time automatically
Join thousands of professionals who stopped guessing where their time goes. Free for 7 days.
“Rize has been a no-brainer for me.” — Ali Abdaal Read more →